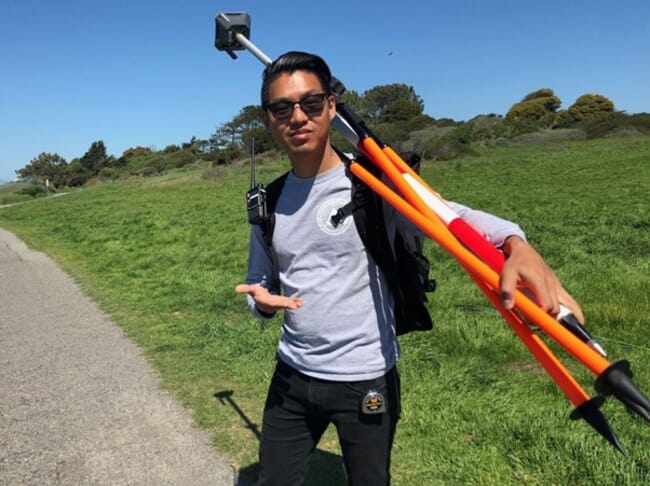
Zack Dinh worked for seven years as a geospatial consultant before co-founding Sea Warden
When did the concept of producing a comprehensive atlas take root?
My specialisation is remote sensing and geographic information science. My entry into aquaculture began while I was a masters’ student at the University of California, Berkeley.
My research interest was planetary-scale monitoring systems for advancing environmental and social impact. Because of my passion for the ocean and seafood, I centred my research on a scalable and repeatable monitoring system for detecting and estimating aquaculture production activity from satellite data using artificial intelligence and cloud computing techniques.
I co-founded Sea Warden to advance the sustainability of farmed seafood by tackling data gaps within the seafood industry by leveraging satellites and AI to monitor global aquaculture activity. To fulfil this mission we have two main objectives: providing satellite-powered monitoring tools for the aquaculture industry, and creating a global atlas of aquaculture for everyone.
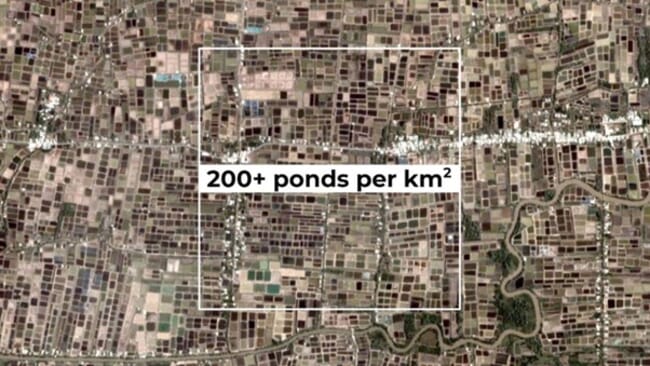
In many areas production densities can reach 200+ production units per square kilometre
Why do you think such an atlas is needed?
More than half the world’s seafood comes from aquaculture – yet no global map of aquaculture exists.
It’s surprising that an industry as large as aquaculture hasn’t been mapped yet. Practically every other industry has a global mapping/monitoring programme: Global Forest Watch, Global Mangrove Watch, Global Fishing Watch, Allen Coral Atlas, Global Solar Atlas, the list goes on.
The UN Food and Agriculture Organisation’s State of World Fisheries and Aquaculture (SOFIA) dataset is the best available dataset regarding global aquaculture activity. While it is remarkable and used widely, it has its flaws: the data countries report is unverifiable (under- or over-reporting is common), and it includes no information about precisely where in each country the production is happening.
Aquaculture around the world is being practised under varying levels of sophistication and regulation. While some countries have the resources to establish robust monitoring programmes, most aquaculture activity is happening in developing countries that must make the most of limited resources to manage massive production areas. Monitoring is not just about enforcement or estimating environmental impact, but it is also vital for planning technical service programmes, infrastructure (such as processing facilities and feed mills) and disaster response.
What sort of information/images will the atlas contain and how will these be presented?
The atlas is best described as Google Maps for aquaculture.
Our definition of an aquaculture atlas is a spatial dataset containing production unit resolution estimates (pond, cage, line resolution). For example, instead of knowing only the volume of shrimp a country produced in a year, the atlas reports how many ponds were in each country, along with the size, shape, and location of each pond. From this information further insights can be estimated: species, production intensity, crop yields, resource use (feed, water, energy) and waste generation (nutrients, carbon). The atlas will contain millions of outlines of ponds, cages and lines. Much like Google Maps, users will be able to query the atlas using search phrases like “extensive shrimp farming in Vietnam.” Users will be able to download raw production unit resolution data for further analysis, as well as summary reports for geographies of interest.
How would it differ from existing sources of information about the industry?
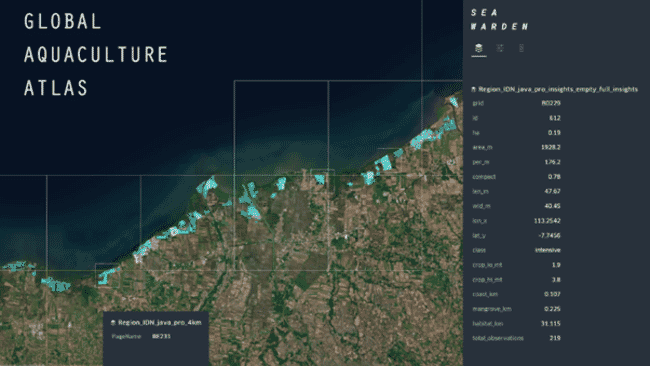
By leveraging satellites and AI, the atlas will provide the highest resolution dataset on global aquaculture activity.
The reason why we specify the atlas as having production unit resolution is because existing landcover maps broadly report areas as aquaculture (example 1, example 2). While broadly understanding the total acreage of an aquaculture region is helpful, not knowing the number, size, shape and location of production units is limiting. For example: with production unit resolution data it’s easy to know that an area featuring many small, square aerated ponds has significantly higher productivity than an area of the same size that contains very large irregularly shaped ponds. Furthermore, having this resolution of data enables the atlas to measure every production unit’s proximity to infrastructure (roads, processing facilities, feed mills) and natural resources (coastline, mangrove, protected habitats).
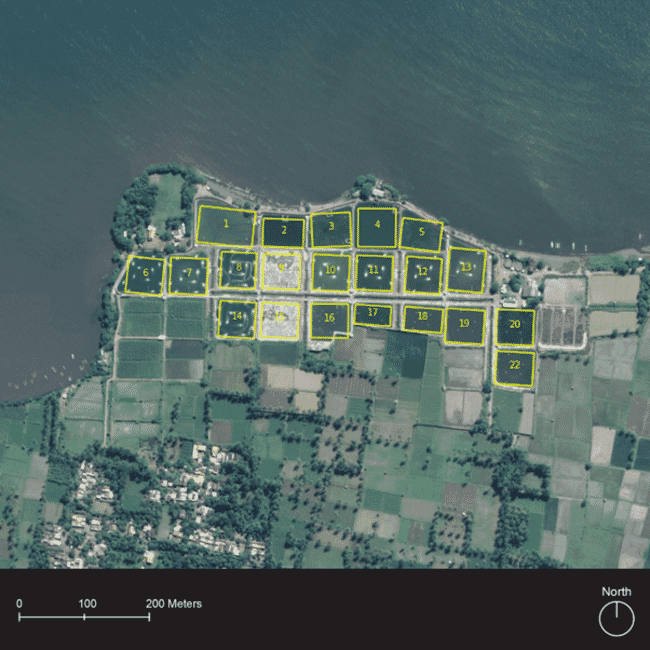
Analysing satellite imagery with AI enables the creation of a production unit resolution aquaculture map
Do you hope to produce a comprehensive global atlas or to phase the project, so that you’re not overwhelmed? How do you plan to obtain the data needed to produce such a comprehensive resource?
Phase 1 will cover shrimp ponds; Phase 2 will cover all pond aquaculture; Phase 3 will include cage and line aquaculture too.
We’re focusing on shrimp for the first phase since shrimp is an extremely large industry ($40 billion global value), producing a product that’s popular with consumers (number-one in the US), and has a strong need for this kind of data collection. While the first phase would only focus on five countries – India, Thailand, Indonesia, Vietnam and Ecuador – collectively they produce 55 percent of global farmed shrimp, and represent a quarter of global aquaculture production.
A large amount of satellite data is freely available but is notoriously difficult to work because of how large the datasets are. The Sea Warden Earth Observation System (EOS) is purpose-built for ingesting large amounts of satellite imagery for processing, using deep learning (we built the system on the cloud so that it has tremendous compute and data storage elasticity. We have models for detecting intensive ponds (square), extensive ponds (irregularly shaped) and cages. Our detection models will actually become more accurate as the project progresses through reinforcement learning (continuous calibration based on past performance).
Currently we’re adding production estimates to our aquaculture detections by using publicly available figures (eg crop yield per hectare of production area). We will continue to rely on this approach, but will also begin to include figures we’re receiving directly from farmers (we have a WhatsApp-based survey tool called Connector).
Atlas will prioritise shrimp production areas first (above: East Java, Indonesia) but will ultimately map all aquaculture systems including cages (below: Lake Victoria, Africa)
How will the atlas be funded? Do you see it as an opportunity that will generate funds for investors over the long term? Would the final product be open access? How often will it be updated?
In the long term we anticipate that revenue from Sea Warden’s subscription services will allow us to update the atlas annually. Our vision is that any user will be able to access the atlas for free, but will also have the option to activate additional monitoring services for particular farms or regions when necessary.
We’re currently seeking a dozen sponsors to fund the first phase. By providing $10-$20k each, sponsors will gain exclusive access to the atlas for 12 months. After this first phase we hope to identify a philanthropic funder to enable us to complete the atlas as a free and open source dataset. Sponsoring the atlas is a great opportunity for individuals and organisations to demonstrate their support for moving the aquaculture industry forward.
What sort of reaction have you had from both potential sponsors and potential users to date?
“A global aquaculture atlas would bring transparency and recognition to the aquaculture industry (and those people working in it) in addition to broad public educational value.”
- Atlas supporter
Based on the survey we created it seems like people are very supportive of the idea. There’s a real recognition in the industry that the lack of a global dataset hinders economic, social and environmental progress in the sector and further generates public mistrust. Potential users see the atlas as a way to accelerate ongoing projects by giving organisations the tools needed to more effectively plan and deploy fieldwork efforts. We are grateful for all the support we’ve received so far, in terms of people sharing their knowledge with us, and we look forward to what we are able to do together.
Regarding progress: we’re already delivering data adhering to the atlas’s format as province-sized datasets to select users. Last year we delivered tilapia cage detections for all of Lake Victoria (the largest lake in Africa), and for several shrimp production regions in Indonesia and Ecuador for the Aquaculture Stewardship Council. The response has been positive, as the data has been valuable for planning field campaigns, and opportunity sites for farm improvement programmes.
What sort of reaction have you had from farmers that you’ve spoken about it to – given that some producers prefer to remain quite secretive?
One of our goals is to elevate the global awareness on the importance of aquaculture. Farming is hard work and we want farmers to be recognised for it. This is something we hear often in conversation with farmers. At the same time, farmers around the world are very resourceful and regularly form cooperatives to pool their resources. We’ve seen farmers creatively use public platforms like Facebook and WhatsApp to build communities and share knowledge. We expect that farmers will find interesting ways to use the atlas to plan production, strengthen community and drive storytelling.
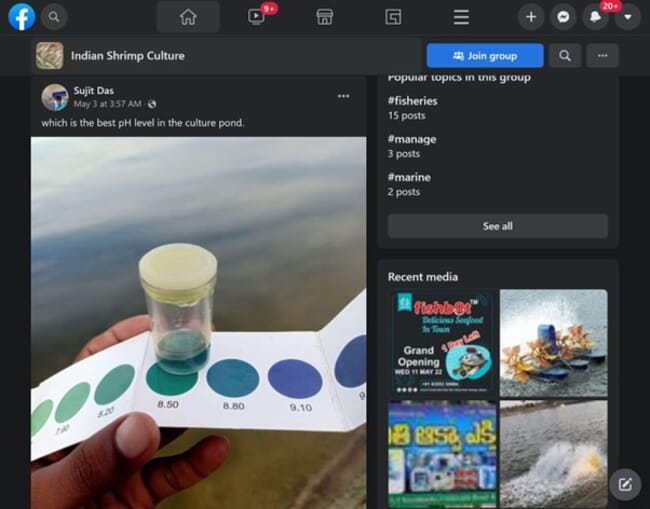
Aquaculture farmers around the world are creative users of technology - Facebook is used widely by farmers for sharing knowledge
What are the major challenges to overcome?
Sea Warden is still a small team, so our challenge is finding the time to work on the project. While many of the steps of creating datasets have been automated, we still have to quality control the data, research production characteristics for particular regions and apply them to the data. We’re currently prioritising the development of our industry-focused monitoring services but hope funding for the atlas will help us expand our team to accelerate the completion.
Where do you envision the atlas to be in 10 years?
Production unit level data for global aquaculture will eventually be the norm. We hope aquaculture tech companies will include the atlas data in their apps and for management agencies to include it in their analyses. In ten years, we hope that many editions of the atlas will have been completed, giving the world an understanding of where aquaculture is increasing and decreasing. Foremost, we hope the atlas elevates global awareness of the importance of aquaculture as a livelihood for millions and food source for billions.
Interested in supporting the creation of the Global Aquaculture Atlas? Show your support by adding your signature to Sea Warden’s survey. Those interested in becoming a sponsor can express this in the comment section of the survey.
*Sea Warden is part of Hatch’s investment portfolio, but The Fish Site retains editorial independence.


