The seafood industry has posted a remarkable recovery from the pandemic in the last year © Rabobank
“The world was recovering from the pandemic in 2021 and, in seafood terms, it’s been a phenomenal recovery,” notes Gorjan Nikolik, Rabobank’s resident seafood analyst, who was the driving force behind the map.
Experts in exports
And, despite his involvement in several previous seafood maps, Nikolik notes that the new one revealed a number of surprising changes from the previous map, which was published in 2019.
“China remains the top exporter, which came as a surprise for us, as we’ve been predicting for a while that it would export less of its seafood – it has a huge, seafood-loving population and its people are getting richer. At the same time it has relatively small food production areas, so is not a natural exporter of seafood,” notes Nikolik.

Nikolik noted a number of emerging trends in the latest seafood export map
“Even though their exports declined slightly in 2020, they rebounded again in 2021, to reach $21 billion – twice the value of seafood exports from the EU and four times more than was exported by the US,” he explains.
According to Nikolik, the main farmed species driving this export value from China were crustaceans such as shrimp and crayfish, while in wild capture, much of the value was accounted for by reprocessed whitefish, such as Alaskan pollock.
The four leading commodities exhibited high double-digit year-on-year growth © Rabobank
Meanwhile Norway came in second place in seafood export value terms, registering exports worth $13.5 billion in 2021 – up from $9 billion in 2015 – largely due to the increasing prices being fetched by farmed Atlantic salmon in the 2016-2018 period.
Ecuador’s exports were also of note, Nikolik points out, given that they increased from $3.5 billion in 2015 to $7.1 billion in 2021 – more than doubling in value in six years, thanks to the country’s increased farmed shrimp output.
Top importers
On the other side of the coin, the combined imports of the US, China, and EU-27+UK were valued at $80 billion in 2021, roughly 50 percent of total seafood trade. Although the EU-27+UK remains the largest seafood buyer by value, importing seafood worth over $34 billion in 2021, since 2013, it has grown at a CAGR of only 2 percent, while in the last five years, the US and China exhibited CAGRs of 6 percent and 10 percent, respectively, each roughly doubling the total value of their imports.
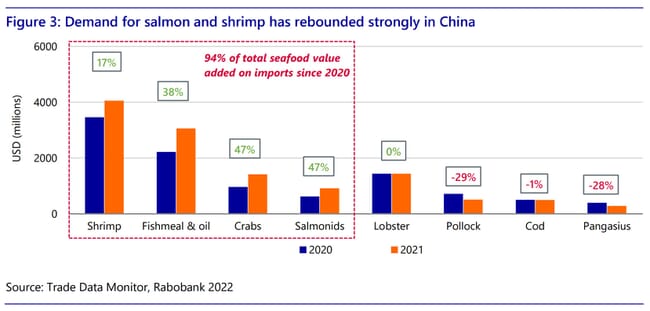
Nikolik notes that in both cases premium seafoods have helped to drive the increased import values – supporting Rabobank’s long-held theory about growing seafood demand in China.
“China’s seafood imports rose from a value of $8 billion in 2015 to $17 billion in 2021, overtaking Japan’s values – which are now at $14 billion – in 2020. This growth was driven by shrimp, fishmeal, crabs and salmonids, all of which exhibited high double-digit year-on-year growth and together accounted for 94 percent of import growth,” Nikolik explains.
“Only the EU (including the UK) and the US are bigger seafood importers than China. The EU’s values rose slightly from $34.6 billion in 2018 to $34.9 billion in 2021, after falling to $31.7 billion in 2020,” Nikolik notes.
“Meanwhile the US figures rose from $22.6 billion in 2015, to $28.1 billion in 2021. This is a reflection of the strong US economy, and has largely been driven by increased imports of salmon, shrimp, crabs and lobsters, which account for 91 percent of the total additional imports,” he continues.
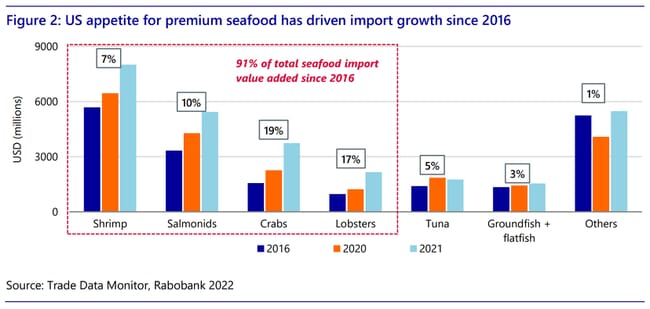
Premium seafoods have helped drive increased import values since 2016 © Rabobank
Indeed, as the map shows, US imports of shrimp, salmonids and crabs experienced CAGRs (2016-2021) of 7.1 percent, 10.3 percent, and 19 percent, respectively.
Specific trade flows
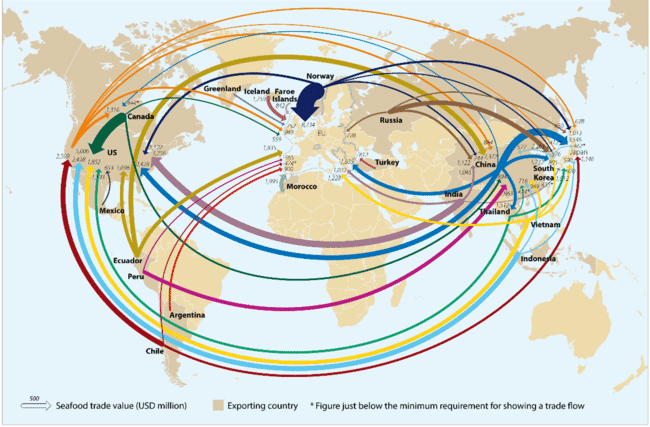
Nikolik draws attention to some of the more significant trade flows outlined in the map – the largest of which is the, “$8.7 billion salmon highway that stretches from Norway to the EU, via Denmark, Germany, the Netherlands, France and Spain.”
Others of note for aquaculture analysts include China’s $3.5 billion a year of seafood exports to Japan, which is dominated by farmed shrimp and crayfish; India’s $3.3 billion of exports (80 percent of which are shrimp) to the US; Indonesia’s $2.4 billion of largely shrimp exports to the US; Ecuador’s $2.3 billion of shrimp exports to China; and Chile $2.5 billion of annual salmon exports to the US.
Combined annual growth rates (CAGRs)
From 2013 to 2021, China’s import volumes exhibited a CAGR of 4.4 percent, while import values had a CAGR of 10.1 percent, highlighting the demand shift to more expensive forms of seafood protein. This trend is further evidenced by the strong rebound in imports in 2021 that followed the initial Covid-19 lockdowns and added $2.4 billion compared to 2020.
Meanwhile the US experienced a CAGR of 7.1 percent from 2016-2021, with salmon increasing by 10.3 percent, crab by 19 percent and lobster by 17 percent.
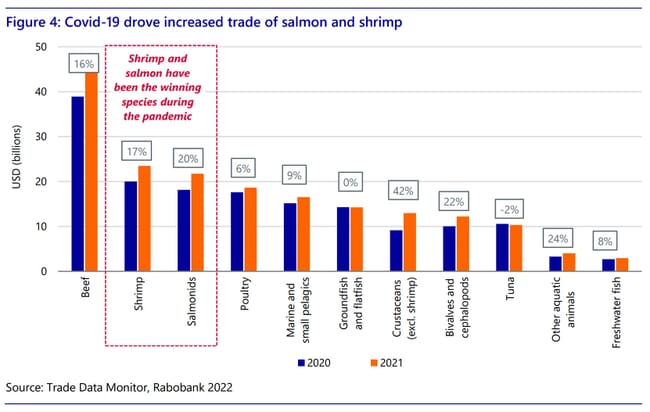
During the pandemic, Rabobank saw higher-value proteins like beef, shrimp and salmonids outperform other proteins © Rabobank
High hopes for high value species
Since 2013, high-value species such as shrimp and salmonids have fared very well, with volume CAGRs of 6 percent and 2 percent and value CAGRs of 3.3 percent and 2.8 percent, respectively. During the pandemic, higher-value proteins such as beef, shrimp, and salmonids outperform others, with year-on-year growth in trade value of 16 percent, 17 percent and 20 percent respectively.
The authors see this trend continuing, unless there’s a global recession.
“We expect sustainability and demand for healthy and premium species to continue driving trade volumes of high-value seafood in the coming years, and exporters such as India and Ecuador are well positioned to capitalise on emerging trends and close the gap in the exporter rankings. We are also seeing unprecedented high prices for many seafood species due to challenges in international trade such as rising freight and energy costs and continued lockdowns in China. However, recent data suggests the impact on seafood demand may become material, especially if a recessionary environment develops in the second half of 2022 or 2023. This could affect seafood market prices and the value of trade flows,” they conclude.
Click here to download a PDF of Rabobank’s World Seafood Map.


