Introduction
Atlantic halibut (Hippoglossus hippoglossus L.) is a large, commercially valuable flatfish that is distributed throughout the North Atlantic (Haug 1990) and has excellent potential for production in aquaculture. Atlantic halibut aquaculture is still in its infancy and, since husbandry and production methods are not completely optimized, genetic contributions to halibut broodstock performance are largely unexplored. Analyses of genetic variability in F1 Fish retained as future aquaculture broodstock have demonstrated the presence of large family groups among these fish (Stefanssonet al. 2001; Jackson et al. 2003), which could easily lead to inbreeding if crosses are not closely monitored. Additionally, the long time (5–7 years) until sexual maturation in halibut (Haug 1990) means that decades will be required to achieve production gains through standard broodstock selection.
In an effort to accelerate halibut broodstock productivity through genetic selection, a coordinated breeding scheme that includes phenotypic selection, family effects, and marker-assisted selection (MAS) based on quantitative trait loci (QTL) has been implemented in Atlantic Canada. A key step in such a genetic improvement scheme is the generation of a genetic linkage map. Genetic maps allow the identification of linkage-groupspecific QTL, which can be further refined by connecting the linkage map with a physical map for candidate gene identification (Ohtsuka et al. 1999).
As a member of the Pleuronectiformes, Atlantic halibut undergo a remarkable metamorphosis early in development, changing from a symmetrical larva to an asymmetrical juvenile (Saele et al. 2004). While eye migration is the most obvious rearrangement during this process, morphological and physiological changes occur in nearly all major organ systems and processes, including skeletal, neural, muscular, optic, pigmentation, digestive, respiratory, and behavioral. Early and complete progression through metamorphosis is an important production characteristic and future QTL studies of halibut metamorphosis should identify chromosomal regions containing genes that control this process.
Recent genetic and genomic analyses of fish (see Volff 2005 for review) have provided insights into the genomic organization and evolution process that underlie the diversity of teleosts. Tetraploidization followed by rediploidization as well as multiple families of transposable elements have clearly affected the organization and gene content of teleost genomes. While genomic sequencing provides the greatest insights into genome organization, genetic mapping studies can be useful for comparative analyses with related species (Reid et al.2005b; Gharbiet al.2006), as well as for investigating genetic organizational processes such as chiasma formation and recombination (Woram et al. 2003). Atlantic halibut has a relatively small genome (0.73 pg of DNA/ haploid cell, as compared to 0.4 pg for Takifugu rubripes) and, as a member of the Pleuronectiformes, is a close evolutionary relative of the well-characterized pufferfish, T. rubripes and Tetraodon nigroviridis. As well, halibut has been shown to have a clear XX/XY sex-determining system (Tvedt et al. 2006). These characteristics of the halibut genome suggest that the halibut linkage map may facilitate comparative genomic studies and provide insights into teleost genome evolution and the mechanisms that guide it.
In this article, we report the construction of an Atlantic halibut linkage map based on 604 microsatellite and AFLP markers. This map, along with current (Japanese founder, Coimbraet al.2003) and forthcoming (turbot, F. Piferrer, personal communication; Senegal sole, M. Ruiz-Rejo´n, personal communication) flatfish maps, will allow researchers to compare interspecies and interfamily genomic conservation among the Pleuronectiformes as well as make broader comparisons among teleosts. The genetic map, along with a moderate number of EST sequences (Douglas et al. 2007) and a recently constructed oligonucleotides microarray (S. Douglas, personal communication), provide a basic tool kit for Atlantic halibut genomic analysis. The Atlantic halibut map reported here will provide a powerful tool both for research into teleost genome evolution and for a foundation for halibut broodstock enhancement programs using MAS.
Materials and Methods
Sampling: Three maternal half-sib families (A1, B2, C3) were created by splitting an egg batch from a single female into three parts and fertilizing each with milt from one of three different males. Offspring from the three crosses were reared together in two 7000-liter tanks through first feeding and weaning in 2003. At approximately the time of weaning from live Artemia to pellet feed (61 days post-first feeding), a sample of 323 ?sh was taken from one of the first feeding tanks. Sampling was conducted by simply running a dip net from the tank bottom to the water surface. Family identity of the sampled fish was determined by genotyping at a single locus (see Genetic analysis). All samples, including parental fin clips, were stored in 95% ethanol until DNA extraction. Gynogenic diploids (n ¼ 46) were from a single unrelated female and were produced using protocols developed by Tvedtet al. (2006).
DNA extraction: DNA was extracted from parental fin clips and whole tail of the F1 progeny (8–10 mg) using the Puregene DNA purification/extraction kit (Gentra Systems, Minneapolis) as per the solid-tissue extraction method. DNA was extracted from gynogen samples using the same method, but was then ampli?ed with GenomiPhi (GE Healthcare, Chalfont St. Giles, UK) to provide sufficient template for PCR reactions.
Genetic markers: A total of 64 AFLP primer combinations (IRDye-labeled EcoRI primers AAC, AAG, ACA, ACT, ACC, ACG, AGC, AGG; unlabeled MseI primers CAA, CAC, CAG, CAT, CTA, CTC, CTG, CTT), were run in each mapping family, following the monoplex protocol in the IRDye Fluorescent AFLP kit for large plant genome analysis (LiCor Biosciences, Lincoln, NE). AFLP nomenclature isEcoRI primer/MseI primer and base-pair size. For example, AAC/CAA155 (female AH-1) is a 155-bp marker using the EcoRI-AAC and MseI-CAA primers.
Atlantic halibut microsatellites were assembled from a variety of sources: 16 were from previous publications (Mcgowanand Reith1999; Coughlan et al. 2000), 121 were isolated from an oligo(GT)-enriched library, including those reported in Reid et al. (2005a), and 92 microsatellite sequences were identi?ed in clones from an EST library for Atlantic halibut (Douglas et al. 2007) using Tandem Repeats Finder (Benson 1999). In addition, 247 microsatellites from other flatfish species were identi?ed in GenBank, 184 of which were from Japanese founder. Supplemental Table 1 provides GenBank accession numbers and primer sequences for all mapped microsatellites. Unlabeled microsatellites were initially screened on 2% agarose gels to ensure that the correct product was generated and, if possible, to detect polymorphisms. A total of 476 forward primers were then synthesized with 59-end labels (ABI or LiCor) and were screened for polymorphisms in the mapping families.
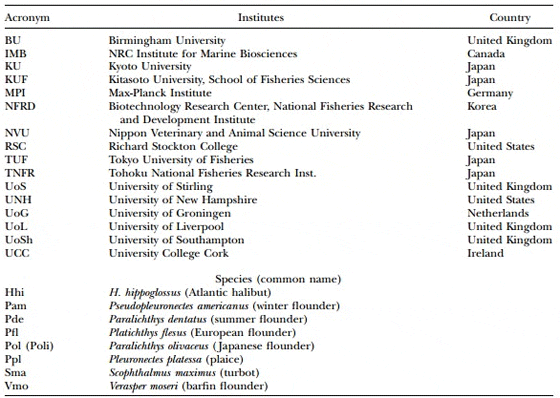
Table 1. Acronyms used for Microsatellite Nomenclature
The standard PCR temperature profile was an initial denaturing at 95for 5 min, 30 cycles of 95for 30 sec, 30 sec at the annealing temperature (50–58), and 72 for 15 sec followed by a ?nal 2-min extension at 72. Variations on this temperature profile were used for optimization of some loci (not shown). The typical microsatellite PCR cocktail was 10ml and included 50 ng DNA, 13 PCR buffer (Promega buffer A), 0.45 mm of each primer, 0.2 mm of each dNTP, 0.05 mg/ml BSA, and 0.3 units Taq DNA polymerase (Promega, Madison, WI).
All microsatellite markers were run either on a LiCor 4200 Longreader and analyzed using the Saga GTII software (LiCor, Lincoln, NE) or on an ABI 377 DNA sequencer with GeneScan software (Applied Biosystems, Foster City, CA). For IRD endlabeled markers (Licor), 5ml of formamide loading buffer was added to the entire PCR cocktail and denatured for 5 min at 95prior to loading 2ml/well. For ABI-labeled markers, 1.1ml of PCR cocktail was added to 2.0ml of loading buffer and 0.2ml of 6-carboxy-X-rhodamine-labeled internal lane standard and 2 ml were loaded per well.
Microsatellite nomenclature follows that of Jackson et al.1998), with a species identifier (first letter of genus and two or three letters of the species), a unique number, and then a three- or four-letter code identifying the institute where the marker was developed. In the case of microsatellites derived from halibut EST sequences (Douglas et al. 2007), an indicator of the library source follows the species identi?er (G, gill; H, head kidney; I, intestine; L, liver; OV, ovary; S, skin; Sp, spleen; TE, testis; L1–L5, larval stages 1–5) and the row letter and column number of the microtiter plate associated with the clone follow. Table 1 provides a list of institution and species acronyms.
Genetic analysis: All 323 sampled fish were pedigreed using one diagnostic marker (Hhi30IMB). On the basis of phenotypic trait variation within each family (data not shown) and number of individuals per family, n ¼ 92 random individuals were chosen from each of the B2 and C3 families for map construction. The A1 family was not used due to an insuficient number of individuals in the sample. When referring to the mapping families, we refer to the female as the B2 female and C3 female, even though they are in fact the same fish.
Segregation data were analyzed separately for each mapping parent by analyzing either the male or the female segregating alleles in the progeny. A goodness-of-fit G-test was used to examine both male and female segregation ratios for all markers for significant deviations from Mendelian expectations. Markers exhibiting significant deviations were reexamined for errors and either rescored or removed from further analysis. Markers with.15% missing genotypic data in any single parent were also removed.
Pairwise recombination estimates and logarithm of odds ratio (LOD) scores were calculated for all marker pairs using LINKMFEX v2.1 (R. Danzmann, University of Guelph). Marker pairs were then assigned to linkage groups at a LOD threshold of 4.0 (P , 0.0001). Within each LOD 4.0 grouping, marker order was determined using both nearest-neighbor and terminalmarker approaches. When these approaches produced alternative-marker orders, the shortest order was selected. Morgan’s mapping function, which simply equates genetic distance with recombination fraction, was used to calculate distances (Morgan 1928). Genotype data were converted to a backcross format and terminal markers and marker order were again checked using Carthagene (De Givry et al. 2005), which uses a multipoint likelihood approach. Comparisons were made between all parents, both within and between the sexes, and the shortest consensus map order was chosen as the final map order. Phase-corrected genotypic vectors for all progeny, generated by GENOVECT (part of the LINKMFEX software package), were examined for double crossovers. Estimation of double crossover frequency used the conservative criteria of Danzmann et al. (2005).
Marker distribution: To examine marker distribution within linkage groups, the Kolmogorov–Smirnov (K–S) test was used to see if the marker spacing between adjacent markers followed a normal distribution (Miller 2006). To examine marker distribution over the entire map, the Pearson correlation coef?cient was used to examine the relationship between linkage group size (in centimorgans) and number of markers (Miller 2006).
Sex-specific recombination: Recombination rates between adjacent markers were compared using a two-way contingency G-test applied to the number of parental and recombinant genotypes inherited, as implemented in the RECOMDIF module of LINKMFEX. Recombination rates were compared between the sexes within families (B2 female:B2 male) and within sexes between families (B2 male:C3 male). Significance was determined after a Bonferroni correction was applied on the basis of the total number of comparisons.
Centromere orientation estimation: Gynogenetic diploids (Tvedtet al. 2006) from a single female halibut unrelated to the mapping families were used to estimate the location of the centromere on all linkage groups (Thorgaard et al. 1983; Kauffman et al. 1995). Absolute centromere location was not possible; however, an estimation of telomeric vs. centromeric ends of the chromosome could be approximated since most chromosomes in Atlantic halibut are subtelocentric or acrocentric (Brown et al. 1997). Marker–centromere distance (d) was estimated, assuming complete interference (Thorgaard et al. 1983; Morishima et al. 2001) as d ¼ y/2, where y is the proportion of progeny with a heterozygous genotype. Where possible, at least three markers per linkage group were genotyped. The 95% con?dence intervals (C.I.) for centromere location were estimated using the method of Johnson et al. (1996) such thatY/N6 2.02{½(Y/N)(1Y/N)/N} 1/2, whereY is the number of heterozygous progeny andNis the number of chromatids used in analysis (i.e., twice the number of progeny).
To compare recombination along the linkage group, most linkage groups were split into two segments (centromeric and telomeric) on the basis of total genetic distance and gene–centromere data for each linkage group. Linkage groups AH-4, AH-14, AH-17, and AH-24 were completely removed from the analysis since we were unable to localize the centromere on these linkage groups and the entire AH-9 linkage group was entered into the telomeric analysis only.
Cross-species comparisons: Linkage group comparisons to Japanese founder were based on the location of common Japanese founder microsatellites. Similarity to T. nigroviridis was detected by Blast searches of halibut sequences containing microsatellites from release 7.0 of the T. nigroviridis genome. Only Blastn search hits withe, 106 were considered significant.
Results
Table 2. Total Markers, Microsatellites, AFLPs, and Total Map Length for each Parental Linkage Map, and Consolidated Maps for Atlantic Halibut (H. hippoglossus L.)
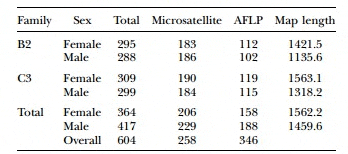
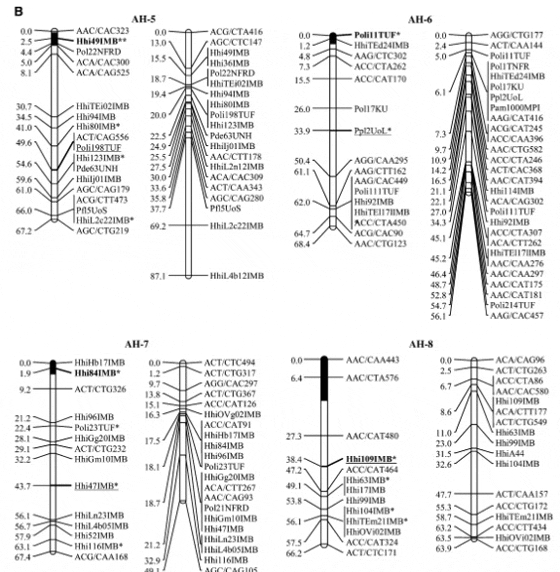
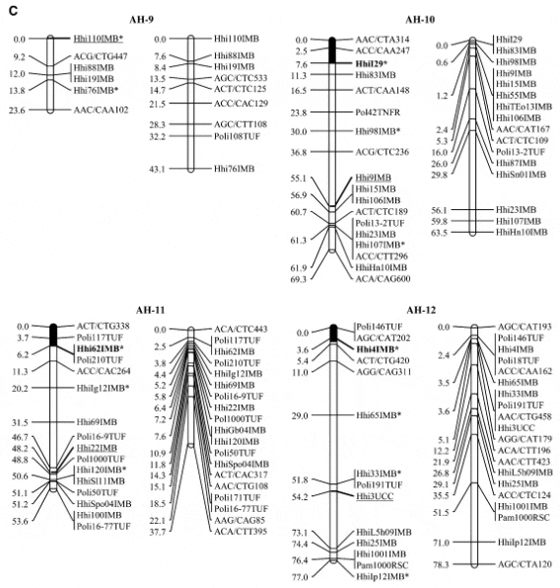
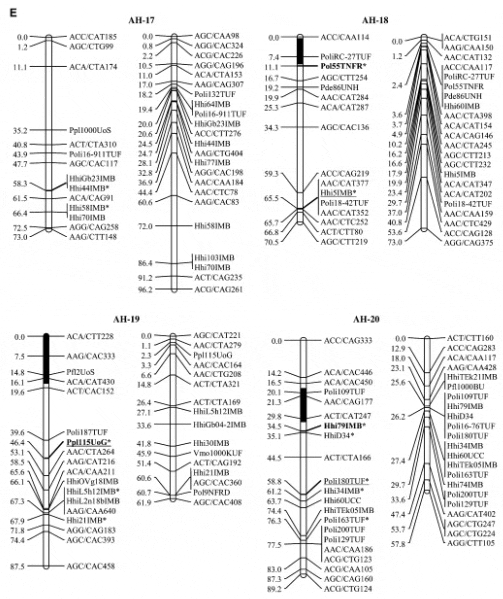
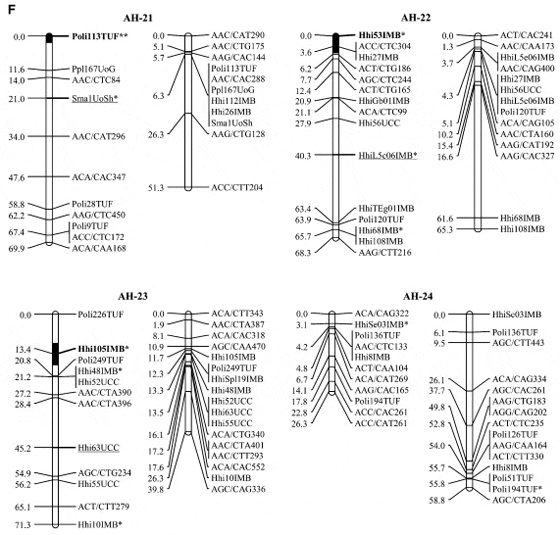
Halibut linkage map: Pedigree analysis of the 323 sampled ?sh from the three half-sib mapping families revealed that there were an insuficient number of the A1 family individuals in the sample and thus the linkage map was constructed using 92 individuals from each of the B2 and C3 families. Analysis of the genotypes of these two families at 632 unique Atlantic halibut markers resulted in the construction of a genetic linkage map containing 24 linkage groups (Figure 1). Maps generated for each parent in the mapping families were similar in the number of markers and overall length (Table 2). The total map length was 1562.2 cM in the female with 364 markers and 1459.6 cM with 417 markers in the male, resulting in an average spacing between adjacent markers of 4.3 and 3.5 cM in the female and male maps, respectively (Table 2). The overall double crossover rate was extremely low (0.002), justifying the use of the Morgan mapping function. The only major difference in map arrangement between the sexes was a split of AH-13 in the male into two smaller sections. The final linkage analysis included 82 individuals from the B2 family and 84 individuals from the C3 family. Most of the individuals that were removed were due to excessive missing genotypes. However, one individual was removed from the B2 family that was a natural triploid.
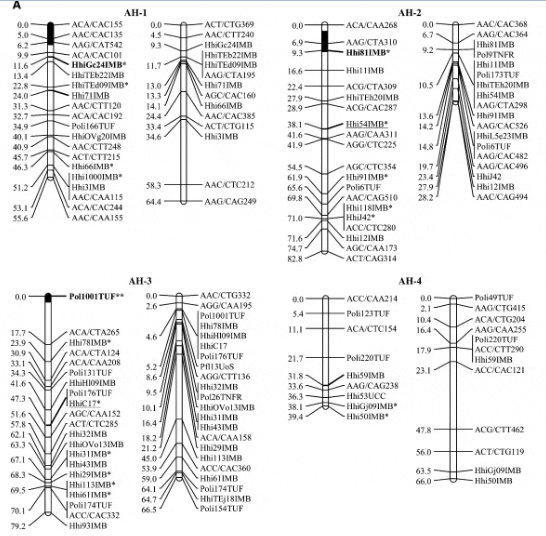
Using the available gynogensamples, gene–centromere distances were estimated for 89 microsatellite markers and used to infer linkage group orientation, including a 95% confidence interval, for centromere location in all but five linkage groups (AH-4, AH-9, AH-14, AH-17, AH- 24) (Figure 1). One marker with 100% recombinants was identified in 19 of 24 linkage groups. Conversely only 4 linkage groups exhibited a marker with 0% recombinant genotypes (AH-3, AH-5, AH-13, AH-21).
Genetic markers: Microsatellites from Atlantic halibut were very informative, with 79% (166/210) exhibiting polymorphism in at least one parent. Of the remaining microsatellites, 25 were homozygous in all parents, 18 produced no scorable product, and 1 was identically heterozygous in all parents. Of the 247 crossspecies microsatellites, 95 were informative in at least one parent, 108 were homozygous in all parents, and 44 produced no scorable product. No microsatellites were removed due to .15% missing genotypes. Only 2 microsatellites were unlinked at a LOD of 4 in all parents for which they were informative (HhiGp14IMB, HhiTEp15IMB). In total, there are 258 unique microsatellites on the map (229 male, 206 female).
A total of 465 unique AFLP markers were identified using 64 AFLP primer combinations in each mapping family. Using a conservative approach, we then eliminated 94 markers: 66 markers were faint or scoring was questionable, 18 markers had poor resolution (.450 bp or ,100 bp), 6 exhibited segregation distortion, and 4 had .15% missing genotypes. The net result was 371 unique AFLP markers that were used in the mapping analysis. Of these, 346 AFLPs were assigned to the map (188 male, 158 female). Of the 207 unique AFLPs in the male (115 B2, 126 C3), 6 were unlinked and 13 were removed due to excessively large mapping distances (.35 cM). Of the 164 unique AFLPs in the females (110 B2, 121 C3), 3 were unlinked and 3 were removed due to excessively large mapping distances.
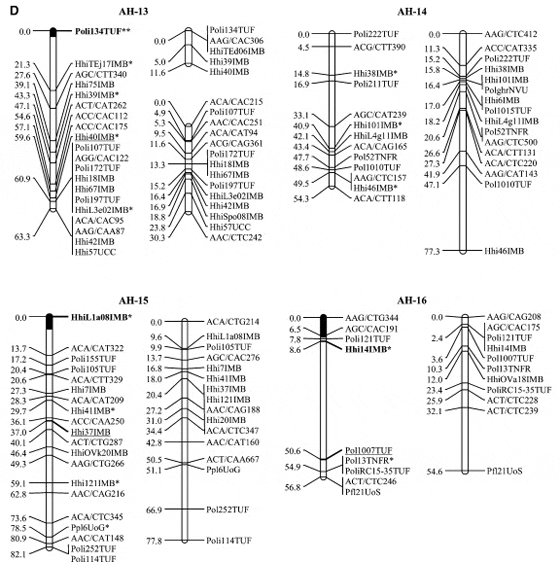
Marker distribution: In all cases, the K–S test for a normal distribution of marker-interval spacing was nonnormal (P , 0.01). The Pearson correlation between linkage group size and number of markers within each linkage group was significant (P , 0.05) in both the male and female maps. In addition, a x 2 test also revealed nonrandom distribution within linkage groups (P , 0.05) in both sexes. For the male map, in linkage groups where the centromere was mapped, almost 50% (152/324) of markers were within 20 cM of the centromere and 80% of markers were within 40 cM (Figure 2). In the female map, only 21% (63/292) of markers were within 20 cM of the centromere. However, 35% (102/292) of markers in the female were found between 60 and 80 cM from the putative centromere whereas only 5% (16/324) of markers in the male were located at this distance from the centromere.
Recombination differences: Overall, the females exhibited greater recombination between adjacent markers, relative to the males (P , 0.001). In the B2 and C3 families, the female showed 1.89 and 2.53 times the recombination of the male, respectively.
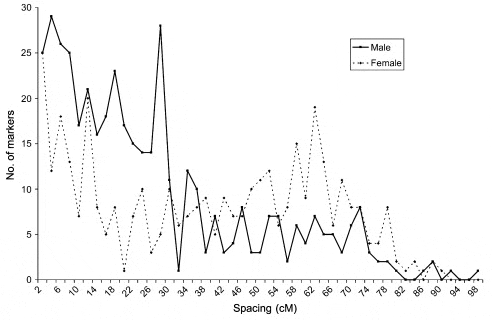
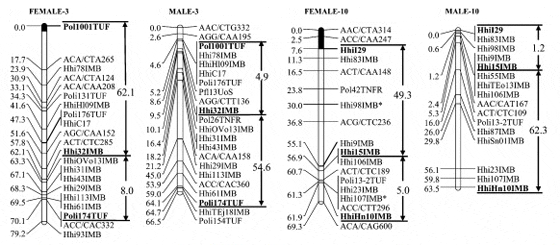
Using the centromere data (Figure 1) as a guide, we split linkage groups into telomeric and centromeric halves and examined differences in recombination between the sexes. A telomeric half was available in 20 of 24 linkage groups, and a centromeric half in 19 of 24 linkage groups. The B2 and C3 males exhibited 3.1 and 2.6 times the recombination of the females in the telomeric halves, while the females exhibited 17.5 and 11 times the recombination of the B2 and C3 males in the centromeric half of the linkage group. Linkage groups AH-3 and AH- 10 exhibit this dichotomy better than most, with the males showing 7 (AH-3) and 12 (AH-10) times the recombination of the females toward the telomere and the females exhibiting 13 (AH-3) and.40 (AH-10) times the centromeric recombination of the males (Figure 3).
There were no significant differences in overall recombination between the B2 male and C3 male (0.92 and 1, respectively) and no overall difference between the females, as expected. There were no significant differences within the sexes in recombination rates along the length of the linkage groups.
Japanese Flounder Markers Common to both Atlantic Halibut Linkage Groups and Japanese Flounder Linkage Groups
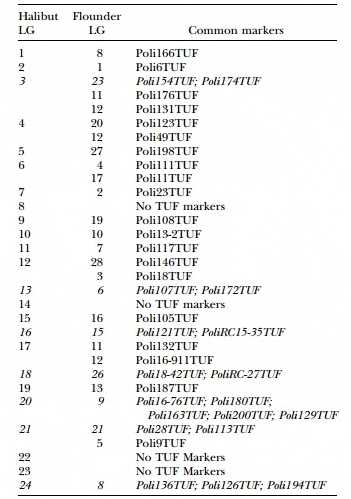
Interspecies comparisons: Of the 227 Japanese founder microsatellites examined, 145 produced a scorable product in Atlantic halibut and 71 of those were polymorphic in at least one of the mapping parents, indicating that there is moderate sequence conservation between species. A comparison of marker order and linkage between the Atlantic halibut map and the Japanese founder map (Coimbraet al. 2003) identified several linkage groups with common sets of microsatellites (Table 3). The most striking conservation was between linkage groups AH-20 and JF-9, which share five markers. However, the large number of markers mapping to the same location in both AH-20 and JF-9 makes a comparison of marker order futile. Linkage groups AH-24 and JF-8 exhibit synteny among the three markers that have the same order in both species. In total, seven linkage groups share two or more markers (Table 3). In contrast, markers from JF-11 and JF-12 were found on multiple linkage groups in halibut. As well, halibut linkage groups 3, 4, 6, 12, 17, and 21 all had markers from two or three Japanese founder linkage groups, indicating that there has been some degree of chromosomal rearrangement since the species diverged.
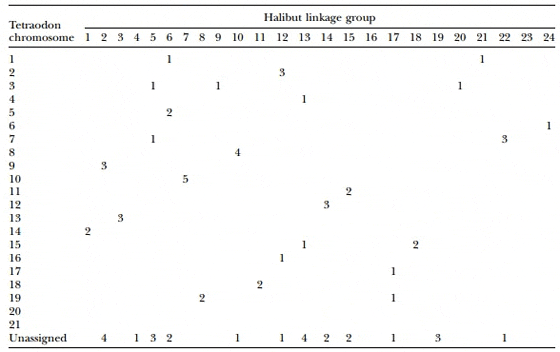
Comparison of halibut microsatellite-containing sequences to theT. nigroviridis genome assembly identified 78 sequences with significant similarity. Of these, 26 were hits toT. nigroviridis contigs that were not assigned to a specific chromosome. Microsatellites from 15 of the halibut linkage groups were associated with a single T. nigroviridis linkage group, although for 4 linkage groups this consisted of only a single microsatellite (Table 4). Five halibut markers from AH-7 mapped to TV-10 while AH-10 and TV-8 share four markers; however, there are variations in marker order between the two species on these linkage groups. Linkage group pairs AH-2 and TV-9 as well as AH-22 and TV-7 each share three markers arranged in the same order, suggesting large blocks of synteny between these chromosomes in the two species.
Table 4. Oxford Plot Comparing the Atlantic Halibut Linkage Map and the Tetraodon Genome
Discussion
Linkage map: The Atlantic halibut linkage map consists of 604 unique markers on 24 linkage groups. Centromere location was estimated for 19 of the 24 linkage groups and most appeared to be terminal or near terminal. As well, the low frequency of double crossovers supports the assignment of most chromosomes as acrocentric (Danzmannet al.2005). Brownet al. (1997) identified the Atlantic halibut karyotype as 24 acrocentric or subtelocentric chromosomes, indicating that our Atlantic halibut map has complete, medium-to-high coverage (#4.3 cM average spacing) of the genome and that our estimates of centromere locations are consistent with the karyotype. The total number of halibut chromosome arms is tricky to determine from the karyotype (Brown et al. 1997), since it is difficult to distinguish subtelocentric chromosomes from acrocentric chromosomes. A generous estimate would suggest 26–28 arms, which, assuming complete interference, would lead to an expected total map length of 1300–1400 cM. The observed total map length of 1562.2 and 1459.6 cM in the female and male, respectively, suggests either that there are a greater number of chromosome arms than are obvious in the karyotype or that the occurrence of recombination hotspots results in extended map distances. Marker distribution: Markers appear to be randomly distributed among linkage groups, as the size of a linkage group (in centimorgans) is significantly correlated with the number of markers (Pearson correlation; P , 0.05). However, markers are not randomly distributed within linkage groups. The x 2 test revealed nonrandom distribution of markers and the K–S test revealed nonnormal distribution of markers within linkage groups. In the male, markers cluster around the centromere, with 50% of markers within 20 cM of the putative centromere location. Although markers seem somewhat more evenly distributed in the female, there is still significant clustering toward the distal ends of the linkage groups (Figure 2).
Chiasma interference: Examining the marker–centromere data from gynogens reveals a high level of chiasma interference in Atlantic halibut, as 35% of the loci (31/88) show 100% heterozygous progeny, suggesting that exactly one crossover occurs between the centromere and these loci. Although lethality in both homozygous progeny classes may be a consideration in a few markers, it is unlikely to explain the 100% recombination fraction observed in 35% of the markers and the lack of significant segregation distortion in these markers in the mapping families. Similar indications of complete interference have been observed in other fish, including channel catfish (Liu et al. 1992), rainbow trout (Thorgaard et al. 1983), zebrafish (Streisinger et al. 1986), and loach (Morishima et al. 2001), suggesting that complete interference is widespread in fish.
Sex-specific recombination: In contrast to Japanese founder (Coimbra et al. 2003), but similar to most teleosts and mammals, we find increased recombination in the female rather than the male. However, the Japanese founder mapping cross was between a normal female and a spontaneous phenotypic male that arose during gynogenesis and thus was a genetic XX/XX cross. The observed higher recombination rate in this phenotypic male is not representative of the heterogametic sex and is likely due to the individual mapping parents, the relatively small number of markers in many linkage groups, an artifact of the spontaneous sex reversal of the male parent, or a combination of these possibilities.
While overall recombination is higher in female halibut, that difference is not consistent along the linkage group and in fact tends to reverse toward the telomeres. Female recombination near the centromere is 17.5 and 11 times greater than in the B2 and C3 males, respectively. Conversely, toward the telomere, the males exhibit 2.5–3 times the recombination of the females. The same trend has been observed in humans (Broman et al. 1998), mice (Lynn et al. 2005), zebrafish (Singer et al. 2002), tilapia (Lee et al. 2005), rainbow trout (Sakamoto et al. 2000), and brown trout (Gharbi et al. 2006). Salmonids show the greatest dichotomy of any vertebrate to date with a female:male ratio of 10:1 near the centromere and 0.14:1 toward the telomere (Sakamoto et al. 2000). The values in Atlantic halibut are similar to those of the salmonids with female-to-male ratios of at least 11:1 near the centromere and 0.38:1 near the telomere.
Differences in recombination between the sexes have been identified in many species, including humans (Dib et al. 1996), mice (Neff et al. 1999), catfish (Waldbieseret al. 2001), zebrafish (Singer et al. 2002), rainbow trout (Sakamoto et al. 2000), and brown trout (Gharbi et al. 2006). In most cases, the heterogametic sex exhibits reduced recombination, and our data follow this general trend as the male Atlantic halibut is the heterogametic sex (Tvedt et al. 2006). Potentially, this difference in sex-specific recombination could be controlled genetically. Alternatively, the sex-specific environment in which the germ cells undergo meiosis may be the reason for differences in recombination. In medaka, sex-reversed XY females have recombination patterns that are very similar to XX females (Kondo et al. 2001), suggesting that sex, rather than genotype, determines the recombination pattern and rate. In mice, an immunohistological examination of the rates and patterns of synaptonemal complexes in pachytenestage oocytes or spermatocytes demonstrated that those from XX, XY, and XO females were similar to each other and significantly different from XY males (Lynn et al. 2005). Lynn et al. (2005) suggest that differences in synaptonemal complex formation in spermatocytes and oocytes form the basis for sex-specific recombination. Longer synaptonemal complexes are present in oocytes of mice and humans (Lynn et al. 2002) as well as zebrafish (Wallace and Wallace 2003) than in spermatocytes, suggesting that sex-specific recombination in vertebrates is a consequence of gamete production. The increased recombination in XX male Japanese founder (Coimbra et al. 2003) clearly does not fit with this hypothesis and remains to be explored further.
Comparative genomics: Due to the limited number of points of comparison between the Atlantic halibut and Japanese founder or T. nigroviridis genomes, strong indications of syntenic relationships between these genomes are difficult to detect. There are, however, a limited number of examples of conserved marker order, as well as several instances where marker rearrangement has apparently occurred, in both comparisons. Atlantic halibut and Japanese founder have similar karyotypes (48, mostly acrocentric chromosomes) and genome sizes (0.71–0.73 pg/haploid genome) (Brown et al. 1997; Fujiwara et al. 2007). However, differences in marker order between the two linkage maps of these organisms would suggest that chromosomal rearrangements have occurred within this conserved karyotype.
Future directions: The Atlantic halibut linkage map presented here provides a basis for further investigations into teleost comparative genomics and for understanding sex determination in halibut. The evolution of genome organization and sex determination varies considerably among teleosts, and the addition of data from halibut will provide insights into the process in the Pleuronectiformes. Also, the map provides an important tool for improving halibut broodstock selection. The next step in this process, the identifcation of QTL associated with markers on the map, is ongoing. Since QTL can be conserved in closely related species (Reid et al. 2005b), future QTL in Atlantic halibut may be applicable to Japanese founder or other flatfish and vice versa. We anticipate that this and future versions of the Atlantic halibut linkage map will form the basis for enhancing halibut broodstock production through MAS.
We thank Shelley LeBlanc of Scotian Halibut and the staff of Scotian Halibut for growing fish and for assistance with sampling. Makoto Matsuoka’s comments on the manuscript are greatly appreciated. This project was funded by an Aquaculture Collaborative Research and Development Program grant from Fisheries and Oceans Canada and by the Genome Canada-Genoma España program PLEUROGENE (Flatfish genomics: enhancing commercial culture of Atlantic halibut and Senegal sole). This is National Research Council of Canada publication no. 42732.
May 2013


