In nature, fish are exposed to a wide variety of microorganisms of bacterial, viral or fungal origins, many of which are capable of causing disease. When fish are reared under controlled conditions, the menace of disease-causing agents increases significantly because confined fish are also exposed to a number of stressors, such as handling, transport, poor water quality and overstocking. These stressors, together with other weaknesses such as physiological unbalance or nutritional deficiency, challenge homeostasis and thus allow opportunistic infections to proceed. As a result, diseases represent a major economic cost, especially when the impact is on fish of high commercial value. Some of these pathogens are fastidious and highly aggressive, causing high mortality rates, while others persist in fish, representing a potential danger to managed fish in aquaculture if an outburst occurs close to harvest. In this scheme, accurate pathogen detection, ideally in the early stages of infection, is necessary in order to design adequate strategies to control key infectious diseases that seriously threaten the sustainability of aquaculture. One of the techniques that has consistently been transversal in specifically detecting sequences of target pathogens in humans, plants and animals, including fish, is real-time PCR because of its sensitivity, specificity, speed, throughput and reproducibility. In the aquaculture environment, this technique has been successfully used to detect, among other pathogens, viral hemorrhagic septicemia virus (VHSV), infectious hematopoietic necrosis virus (IHNV), salmon alphavirus (SAV), Piscirickettsia salmonis, Renibacterium salmoninarum, infectious salmon anemia virus (ISAV), and infectious pancreatic necrosis virus (IPNV).
Nevertheless, massive application of this technique requires correct setup of the assay, including the necessary controls, for unequivocal interpretation of the results. Among the most important of these controls is an endogenous reference control that is able to provide information not only about the amount of the detectable target nucleic acid in the sample to be analyzed but also about the sample integrity in order to accurately validate processes such as sampling, transport, and nucleic acid isolation, allowing degradation of the samples to be detected. This is not a simple task to achieve, as determining the proper endogenous levels of a given marker molecule depends on a number of variables, including the target organ and the type of nucleic acid to be detected. In the case of targeting viral RNA, specifically for the diagnosis of the ISA virus in infected tissues of fish, the use of the elongation factor 1 alpha (ELF1α) has been demonstrated to be a reliable reference RNA-expressed control because of its stability and constant expression in Salmo salar organs, in both the presence and the absence of the ISA virus. Additionally, because of its relevance, ELF1α has also been recommended as a housekeeping gene for gene expression analyses of other salmonid fish-related pathogens, such as Piscirickettsia salmonis, SAV, and VHSV.
Although an ELF1α-driven assay has been successfully used for ISAV detection in Salmo salar samples, it is also known to have a highly variable performance when used for the diagnosis of other reared salmonid species, particularly Oncorhynchus kisutch and Oncorhynchus mykiss, which together with Salmo salar, constitute the economically important species cultivated in Chile. For this reason, we considered it imperative to analyze the sequence variability associated with a presumptive polymorphism in the ELF1α coding sequence of the three salmonid species cultivated in Chile; we would then be able to design a transversal RT-qPCR assay that would allow us to use the same parameters to accurately determine the quantity and quality of the samples, regardless of the salmonid species tested and thereby reliably diagnose RNA pathogens.
Results and discussion
Sequence variability evaluation
Because salmon production in Chile relies on two additional species that are different from Salmo salar, we decided to compare the potential nucleotide variability in the RT-qPCR amplifiable target region of ELF1α in all three salmonid fish species reared in Chile, as variability in this region could be causing the species-dependent performance of the assay. cDNAs from 20 tissue samples from Oncorhynchus mykiss and Oncorhynchus kisutch were amplified, and the PCR products were sequenced directly to avoid any sequence selection bias that might result from a plasmid cloning process. The electropherogram profiles (data not shown) consistently showed double peaks at four positions on the amplified region: one at the forward primer annealing position, one at the probe annealing position, and two at the reverse primer annealing position (Figure 1). It is particularly relevant that one of the two mismatches detected by the reverse primer was situated at the 3′ end, which could seriously interfere with the efficiency of the amplification process. According to previous studies, the presence of double peaks in the electropherograms could be explained by the presence of heterozygosity, SNPs or sequence insertions. Although not the main focus of this work, the information obtained here allowed us to design novel transversal primers and probes that are able to specifically amplify and detect selected ELF1α coding sequences in the three fish species reared in Chile with the same degree of accuracy.
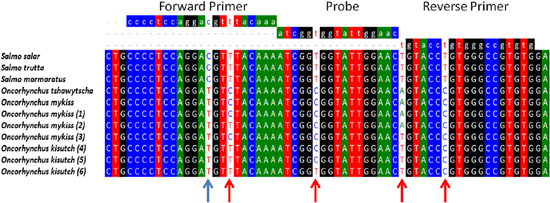
To determine whether differences detected in the amplification could be overcome to generate a transversal RT-qPCR reaction, multiple alignments were made with the sequences derived from this study, as well as with those available in the GenBank database. Figure 1 shows that using the BioEdit software, it was possible to identify two types of nucleotide variations where we could detect double peaks in the electropherograms. First, an “intragenus conserved variation” consisted of a cytidine residue in the forward primer annealing position for all species of the Salmo genus analyzed, which was changed to a Thymidine residue for the two species of the Oncorhynchus genus analyzed (blue arrow in Figure 1). Additionally, we identified an “intragenus nonconserved variation,” which did not correlate with specific changes in each genus (red arrow in Figure 1).
Design of a new transversal assay
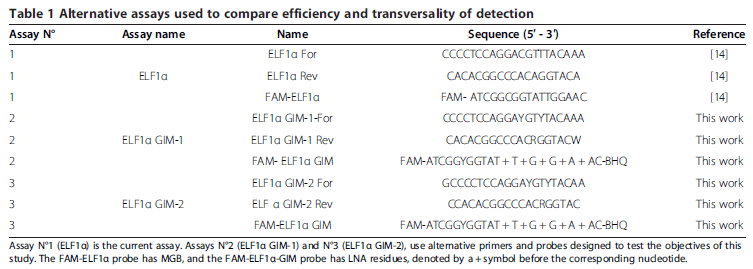
Considering the nucleotide variations previously shown, we were in a position to design a new assay to detect ELF1α in all salmonid fish species cultivated in Chile. It is well-known that nucleotide variations in the annealing positions of primers and probes affect the sensitivity and efficiency of this type of reaction, as they can lead to putative underestimations of the actual amount of template present in a sample. Although it may seem trivial, mismatches between primers and probes on a given template actually constitutes an important issue to consider in the generation of a highly specific and reproducible detection assay. We chose to use degenerate nucleotides in the probes and primers involving internal nucleotide variations as a testing strategy. Additionally, we moved the reverse primer one nucleotide downstream from the probe, taking into account that a variation in the 3′ end could dramatically affect the performance of the assay. Table 1 shows the three assay conditions evaluated and compared in this work. Assay N°1 (ELF1α) is the assay currently in use. Assay N°2 (ELF1α GIM-1), uses the same sequences as assay N°1, but incorporates degeneracy in the variable positions. Assay N°3 (ELF1α GIM-2) employs different primers to eliminate the 3′ end degeneration in the original reverse primer. The same probe was used for assays N°2 and N°3, which differ from each other only in terms of the primers used.
Evaluation of the alternative new assays
Initially, performances of the two novel alternative assays (N°2 and N°3) were compared against the classical one (N°1) using templates obtained from S. salar, O. kisutch and O. mykiss tissue samples. For this comparison, the detecting probe was used without an MGB or LNA system. Under these conditions, the probe displayed a Tm value of 49.9°C, which was calculated using OligoCalc and which suggested low stability in the annealing process of the probe and template. This allowed us to evaluate the performance of the assay based on the condition that any mismatch could affect the results considerably, thus making it easier to detect any improvement.
The results of the three assays in Table 2 clearly show that assay N°3 performed better than assays N°1 and N°2 and was therefore selected for further evaluation. Assay N°3 had lower Ct values and higher relative fluorescence than the other two assays for all samples evaluated. As expected, the Ct value differences between assays N°1 and N°3 were higher between samples from O. mykiss and O. kisutch species. This is because assay N°3 takes into account the nucleotide variability in the amplification region for this genus, thereby avoiding the mismatches observed in assay N°1. In the same way, samples from S. salar showed slighter differences in Ct values between assays.

Although both alternative assays (N°2 and N°3) considered the existing nucleotide variability of the species tested, the performance of assay N°3 was notoriously better than that of assay N°2. We hypothesize that this effect may be a result of a structural interference between the primer and the probe and not primarily of the template mismatches.
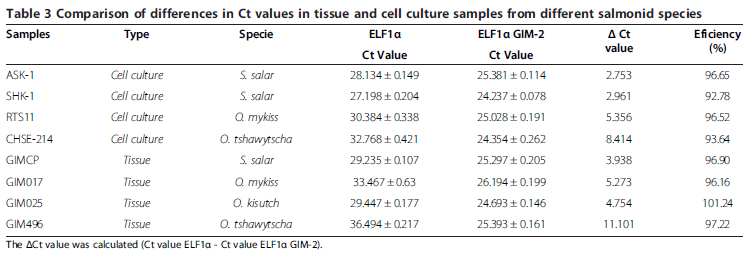
The next step in the evaluation was to consider the design of a more stable assay by increasing the Tm of the probes and thus increasing the annealing stability between the probe and the template. To achieve this objective, MGB was used on the probe of the ELF1α assay, as reported previously and Locked Nucleic Acid (LNA) was used on the probe of the ELF1α GIM-2 assay. The comparison was made between assay N°3 (selected new assay) and the original assay N°1 (reference assay) considering samples derived from both tissues and cell cultures from different species of salmonids. Table 3 summarizes our results, showing that, as expected, cell culture and tissues samples from S. salar had lower ΔCt values between assays (Ct value ELF1α - Ct value ELF1α GIM-2), while cell culture and tissues samples from the Oncorhynchus genus had higher differences in Ct values between assays and therefore a higher ΔCt. The largest differences, however, were observed between samples derived from O. tshawytscha, where a maximal ΔCt value of 11.101 was obtained from tissue-derived samples.
Although only LNA was used in the probe of the ELF1α GIM-2 assay, we would expect a similar result when using MGB as an enhancer.
The evaluation of the efficiency of assay N°3 for all samples tested is shown in Table 3. All values for the RT-qPCR reactions fell within the suitable experimental range (90 per cent-110 per cent).
Evaluation of field samples
The final evaluation compared assay N°3 (ELF1α GIM-2) with the original assay N°1 (ELF1α), using the same distribution of LNA as a system to increase the probe Tm value in both assays. Field samples from S. Salar (n = 98), O. mykiss (n = 97) and O. kisutch (n = 82) were obtained from different farms located in the south of Chile, and parallel assays were run under the same RT-qPCR conditions (reagent mix, software setup, and data analysis). Four (out of 82) samples from O. kisutch were withdrawn from the analysis because they could interfere with the correct analysis because they displayed ΔCt values over 9, and one of them had a ΔCt value of 16. This result suggested that this might be due to several mismatches between the template and the primers and the probe of the ELF1α assay.
An integral analysis of the data shows that, similar to previous results, S. salar samples displayed smaller differences between assays N°3 and N°1, which was expected, as the latter was designed to specifically fit S. salar sequences. Samples from O. mykiss and O. kisutch displayed higher differences in Ct values, as seen in Figure 2. Therefore, ΔCt values depend on the salmonid species analyzed. Furthermore, no significant differences in ΔCt values were observed between the O. mykiss and O. kisutch samples analyzed.
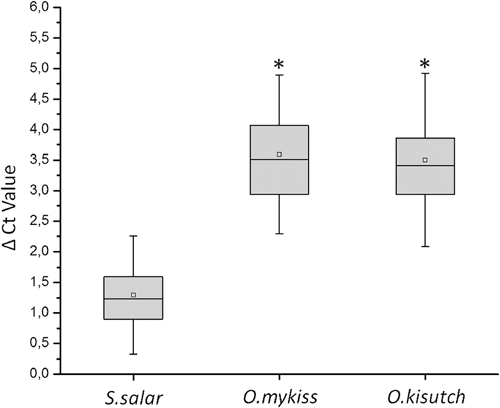
Figure 3 shows the Ct values displayed in each assay from field samples of the three salmonid species. As expected, the new assay N°3 (ELF1α GIM-2) displayed no significant differences among the Ct values obtained (Figure 3B). When the original assay N°1 (ELF1α) was used, significant differences were observed between Ct values of samples from the S. salar and Oncorhynchus species (Figure 3A).
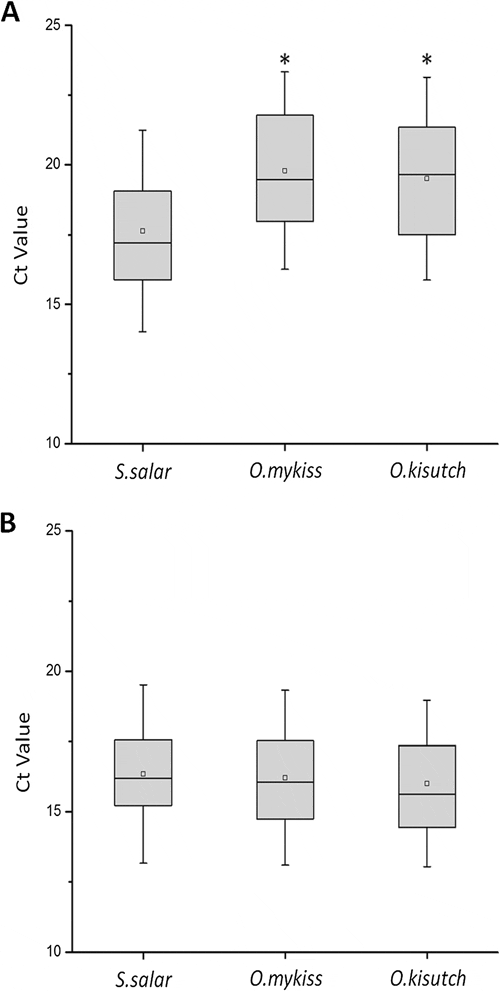
These differences in Ct values reveal the importance in diagnoses of an adequate endogenous control. Indeed, using assay N°1, samples derived from S. salar display Ct values within a valid range for diagnostic purposes, whereas samples from the Oncorhynchus group display higher Ct values, some of which were beyond the valid range for diagnoses. Thus, incorrect diagnoses may occur as a result of a weak detection assay design; however, this effect is corrected in the new assay.
Conclusions
Here we identified nucleotide variability in the amplified region of ELF1α, which causes highly variable results when the ELF1α assay is used as an endogenous control for Oncorhynchus species. Using this information, we have designed and improved a single reliable and efficient assay (ELF1α GIM-2), driven to an endogenous cellular quality control, to be used in RT-qPCR diagnostics of pathogenic agents in tissue samples from the salmonid species analyzed in this work.
December 2013


