A distinction is made throughout the report between financial performance and economic performance. Financial performance estimates are calculated for the average boat in a fishery and include all cash receipts and cash costs that have been earned and incurred within the survey period. These estimates reflect the average boat’s profit and loss statement for all business activities, including in cases where they have operated in a number of fisheries. The indicator of economic performance presented in the report is net economic returns (NER), which is reported at the fishery level. The NER estimates differ from financial performance estimates because they relate only to the surveyed fishery and include other economic costs such as depreciation, the opportunity cost of capital and the opportunity cost of labour. For definitions of these costs, see Appendix A.
Each indicator provides different information. Financial performance information provides a context for trends in the surveyed fishery; for example, positive financial profits at the boat level may reveal how operators continue to operate in a fishery that has experienced negative economic returns. These estimates are more relevant for industry operators, who can compare their performance to that of the average boat.
Economic performance is most relevant for fishery managers and policymakers. This is because NER relates only to the specific fishery being managed. Moreover, by taking into account all cash receipts, cash costs and economic costs, NER indicates the economic return to society associated with harvesting the fishery resource. For this reason, NER is the key economic performance indicator referred to in the Fisheries Management Act 1991. According to the Act, the Australian Fisheries Management Authority (AFMA) is required to maximise NER to the Australian community through managing Commonwealth fisheries. Although estimates of NER do not reveal how a fishery has performed relative to maximum potential NER (maximum economic yield) in a given period, interpretation of NER trends and drivers can assist in assessing AFMA’s performance against this objective. Such interpretation is also discussed in Appendix A.
In 2012 the fishery survey collected demographic indicators for the first time. A summary of the age of skippers, fishing experience and educational attainment provides a background to the fishery and are provided in this report. The median sale price for permanent transfer of quota for key species in each of the fisheries has also been provided. As this information continues to be collected in future surveys, ABARES will have greater capacity to draw on survey data to respond to emerging policy issues.
ABARES has undertaken surveys of key Commonwealth fisheries since the early 1980s and regularly since 1992. The historical time series of data that has been collected through these surveys allows a number of economic tools and indicators to be constructed to assess AFMA’s performance against its economic objective. These include productivity indexes, profit decompositions, efficiency analyses and bioeconomic models. A list of earlier fisheries surveys reports is presented at the end of this report.
Data for the Eastern Tuna and Billfish Fishery (formerly the East Coast Tuna Fishery) are available for every year since the 1989–90 financial year. For the Gillnet, Hook and Trap Sector (previously the South East Non-Trawl and the Southern Shark fisheries) of the Southern and Eastern Scalefish and Shark Fishery (SESSF) data are available from 1988–89 and then for every year from 1990–91 until the present survey. For the Commonwealth Trawl Sector (formerly the South East Trawl Fishery) of the SESSF data have been collected sporadically since 1978–79 and then for every year from 1989–90 until the present survey.
Chapter 2: Eastern Tuna and Billfish Fishery
The fishery
The Eastern Tuna and Billfish Fishery (ETBF) is a multispecies fishery that stretches from the tip of Cape York to the South Australian–Victorian border and includes the waters around Lord Howe Island and Norfolk Island (Map 1). The key ports for this fishery are Bermagui, Cairns, Coffs Harbour, Mooloolaba, Southport, Sydney and Ulladulla (Kirby et al. 2012). Commercial fishing occurs in longline and minor line sectors; the longline sector accounts for most of the fishery’s catch, effort and gross value of production (GVP).
The fishery targets some internationally shared stocks. Commonwealth management of the ETBF takes into account Australia’s obligations to the Western and Central Pacific Fisheries Commission, which is the regional fisheries management organisation through which internationally shared stocks are jointly managed with other countries.
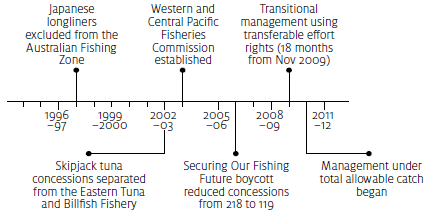
In March 2011 the fishery moved to a system of a total allowable commercial catch (TACC) for key target species, with individual transferable quota entitling holders to a share of the TACC. This superseded transitional arrangements whereby the fishery was managed within a total allowable effort limit with transferable effort rights, which was in place for 18 months ending 28 February 2011(Kirby et al. 2012). The system of TACC with individual transferable quotas (ITQs) is aimed at managing catch in the fishery while allowing operators to choose the most cost-effective way of operating their business. This allows operators greater flexibility in adapting their business to improve the profitability of their operations.
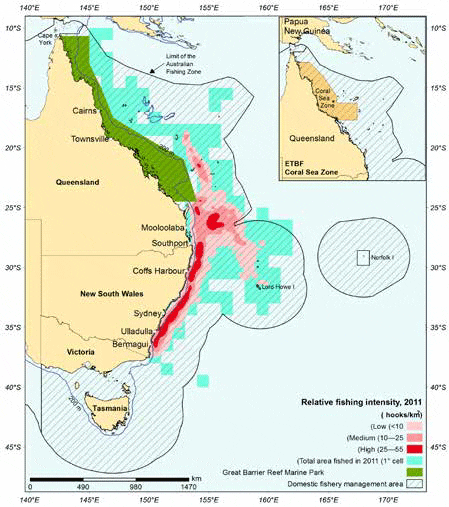
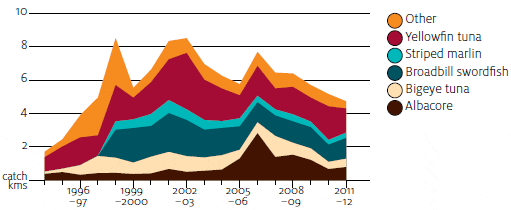
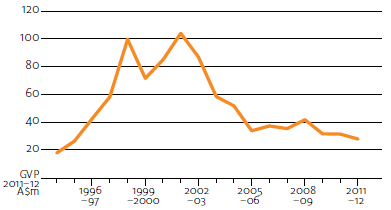
The main target species in the ETBF are yellowfin tuna, bigeye tuna, albacore, swordfish and striped marlin (Figure 1), which together accounted for around 94 per cent of GVP in 2010–11 (ABARES 2012). Further information on the fishery, including the biological status of key species, can be found in the ABARES Fishery status reports 2011 (Kirby et al. 2012).
The median age of skippers surveyed in the fishery was 45 years in 2010–11. Skippers had a median of 14 years of experience in the ETBF and 18 years of fishing experience in total. Eighty per cent of respondents’ highest level of educational attainment was primary school or year 10, and the highest qualification was the completion of year 12.
Timelines of the Eastern Tuna and Billfish Fishery, 1994–95 to 2011–12
Financial performance
The survey population for a given year was defined as any boat that recorded more than 1 tonne of catch in the ETBF. The population was 54 in 2009–10 and 51 in 2010–11. The survey sample was 17 in 2009–10 and 14 in 2010–11, representing 40 per cent and 36 per cent of the catch, respectively.
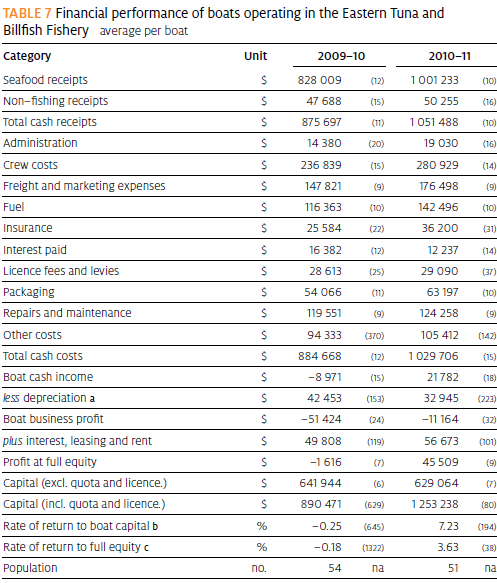
The average financial performance of boats operating in the ETBF improved between 2009–10 and 2010–11. This is reflected in all measures of profitability (Table 7).
Total cash receipts rose by 20 per cent between 2009–10 and 2010–11. This was driven by a 21 per cent increase in seafood receipts per boat, partly as a result of relatively constant fishery receipts being shared between fewer boats.
Cash costs increased by 16 per cent, a lesser degree than the increase in cash receipts. Crew costs, freight and marketing, fuel and repairs and maintenance were the major cost categories in both years, representing 70 per cent of total costs in 2010–11. Fuel costs rose by 22 per cent, crew costs and freight and marketing expenses each increased by 19 per cent, and repairs and maintenance costs increased by 4 per cent.
Boat cash income increased to $21 782 in 2010–11, from -$8 971 in 2009–10. Depreciation fell by 22 per cent to $32 945 in 2010–11, which contributed to boat business profit rising from -$51 424 to –$11 164. Profit at full equity, which represents boat business profit as though operators owned all of the capital in their business, increased to $45 509 in 2010–11 from -$1616 in 2009–10. This was as a result of increased boat business profit and an increase in the costs items of interest, leasing and rent, which are excluded from this profit measure.

Economic performance
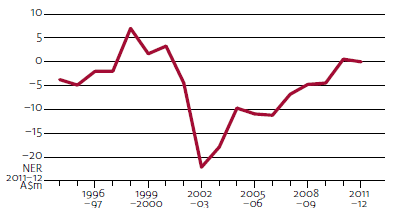
The economic performance of the fishery continued its improvement since 2006–07. In 2010-11, the fishery achieved positive net economic returns (NER) for the first time since 2000–01 (Figure 1).
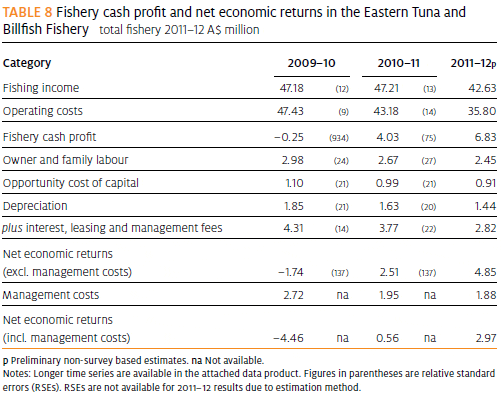
Between 2009–10 and 2010–11 improved economic performance in the fishery was driven primarily by reduced operating costs. Fishery income remained fairly constant; however, a reduction in the number of boats operating in the fishery may have driven the reduction in costs; the most efficient boats are likely to have remained in the fishery. The opportunity cost of capital and depreciation costs decreased between the two survey years, and management costs fell by 28 per cent. The reduction in overall costs resulted in NER (including management costs) becoming positive for the first time since 2000–01, increasing to $564 000 in 2010–11, up from –$4.5 million in 2009–10 (Table 8).
In 2011–12 NER is estimated to increase to $3.0 million. Revenue and operating costs are both estimated to decline, with the decline in operating costs proportionately larger than the decline in revenue. The main driver for reduced operating costs is a fall in boat numbers, total effort, catch (which affects some key variable costs) and the estimated distance travelled by the ETBF fleet.
Following a build up in capital to 2000–01, the fishery has been catching lower volumes of fish (26 per cent decrease to 5169 tonnes in 2010–11) and fleet size has fallen (survey population fell by 61 per cent to 51 boats in 2010–11). Average real beach prices have fallen by 52 per cent to $5.98 per kilogram in 2010–11 from $11.76 per kilogram in 2000–01, corresponding with an appreciation of the Australian dollar against the yen and the US dollar (of 27 per cent and 83 per cent, respectively). The ETBF was targeted in the Securing Our Fishing Future structural adjustment package in 2006, which further contributed to the already declining fleet size (down from around 150 boats in 2002 (Kirby et al. 2012)).
The ETBF had some of the characteristics of an unmanaged, open access fishery in the past, with estimates suggesting that the fishery earned only very small or negative NER before 2008–09 (Kirby et al. 2012). However, despite external pressures such as rising fuel prices and the appreciation of the Australian dollar, NER in the fishery have consistently increased since its low in 2002–03 of –$22.0 million.
Since transitioning to ITQs in March 2011, estimates for the value of quota for individual species have been difficult to ascertain. Anecdotally quota prices were highly volatile, with operators suggesting yellowfin tuna quota prices increased considerably throughout 2011 and albacore quota prices fell. The sale price for bigeye tuna quota during the 2011–12 season is estimated to be around $10.00 a kilogram, for yellowfin tuna is estimated at $11.00 a kilogram and for broadbill swordfish is estimated at $6.50 a kilogram.
Chapter 3: Commonwealth Trawl Sector
The sector
The Commonwealth Trawl Sector (CTS) is the highest value sector, in terms of gross value of production (GVP), of the Southern and Eastern Scalefish and Shark Fishery (SESSF). It stretches from Sydney southward around Tasmania to Cape Jervis in South Australia, where it abuts the Great Australian Bight Trawl Sector (Map 2). Key ports in the CTS are Ulladulla, Eden, Lakes Entrance, Hobart and Portland (Ward et al. 2012). Both Danish seine and trawl boats operate in this sector.
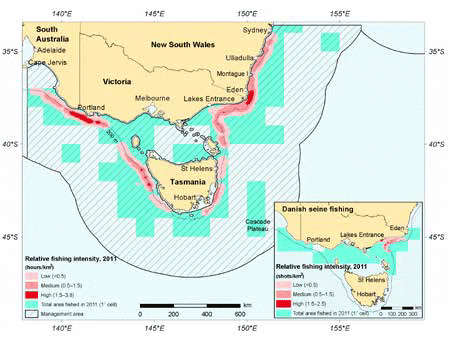
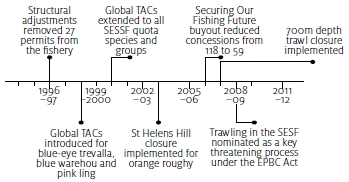
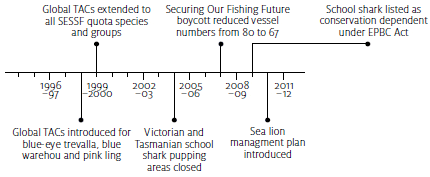
A management system of total allowable catch (TAC) limits with individual transferable quota was first introduced in the SESSF in 1998, and global TACs were extended to cover all 16 quota species and groups in 2001. In 2006, the Securing Our Fishing Future structural adjustment package resulted in the removal of half of the 118 concessions originally available in the sector (Figure 2).
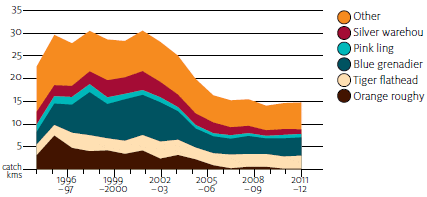
The CTS is a major source of Australian fresh fish for the Sydney and Melbourne markets. Key target species include tiger flathead, blue grenadier, pink ling and silver warehou. These four species collectively accounted for 65 per cent of the sector’s GVP in 2010–11 (Figure 2) (ABARES 2012).
The median age of skippers surveyed in the sector was 38 years in 2010–11. Skippers had a median of 19 years fishing experience and usually all of that was spent in the CTS. Just under half of respondents’ highest level of educational attainment was beyond year 10, and almost one-quarter had a tertiary education.
Timelines of the Commonwealth Trawl Sector, 1996–97 to 2011–12
Economic performance
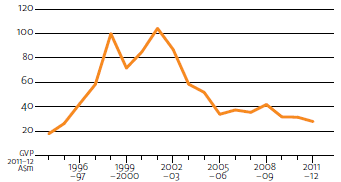
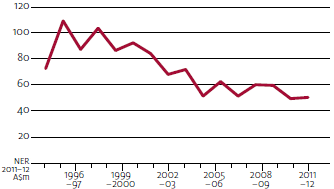
Net economic returns (NER) including management costs increased by $4.3 million to $6.8 million in 2010–11, representing a 173 per cent increase from 2009–10. In 2011–12 NER are estimated to have decreased to $5.5 million, as lower management costs partly offset declines in sector cash profit and interest, leasing and management fees.
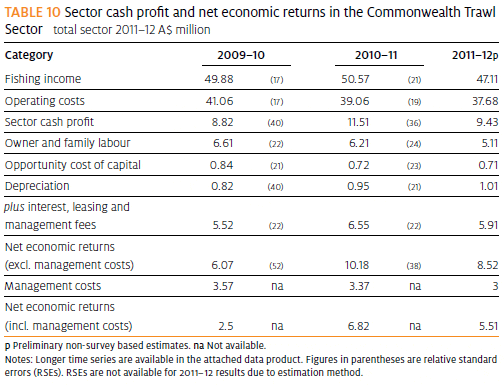
The increase in NER in 2010–11 was driven by a combination of higher sector cash profit and increased interest, leasing and management fees. A rise in fishing income and a decline in operating costs resulted in sector cash profit increasing by $2.7 million to $11.5 million. The marginal rise in fishing income reflected a 5 per cent increase in total catch volume, which offset lower average unit prices for the majority of target species in the sector.
NER in the CTS have been generally positive since 2004–05 (Figure 2). Combined with the reductions in boat numbers and associated increases in economic productivity (Skirtun & Vieira 2012) this suggests that the CTS has moved closer to maximum economic yield (MEY)—the economic target outlined in the Commonwealth Harvest Strategy Policy (DAFF 2007). This is consistent with the estimated current biomasses of at least three of the four most valuable species being close to the MEY biomass targets (Ward et al. 2012). This indicates that the economic status of the CTS is positive and has substantially improved since 2004–05.
Quota prices in the CTS were collected predominantly from Danish seine operators and as such may not be indicative of quota values in the sector as a whole. The species for which response rates were the greatest and thus had the most reliable data were tiger flathead and eastern school whiting. The median sale price of tiger flathead quota for permanent transfer was $26.00 a kilogram in 2010–11, while eastern school whiting quota was $3.00 a kilogram. In 2010–11 tiger flathead, blue-eye trevalla and pink ling tended to be higher priced quota species and ocean perch, silver warehou and eastern school whiting tended to be lower priced quota species.
Chapter 4: Gillnet, Hook and Trap Sector
The sector
The Gillnet, Hook and Trap Sector (GHTS) of the Southern and Eastern Scalefish and Shark Fishery (SESSF) extends south from southern Queensland to the western border of South Australia, and includes waters to the south of Tasmania (Map 3). Key ports include Lakes Entrance, Port Lincoln, San Remo, Port Welshpool and Devonport (Woodhams & Vieira 2012). Gear types that can be used in the sector include gillnets, droplines, demersal longlines, automatic longlines and, to a lesser extent, traps. Most catch in the sector is caught by gillnet operators (84 per cent in 2010-11). Financial results for gillnet operators have been presented separately from those for the sector as a whole (Table 9).
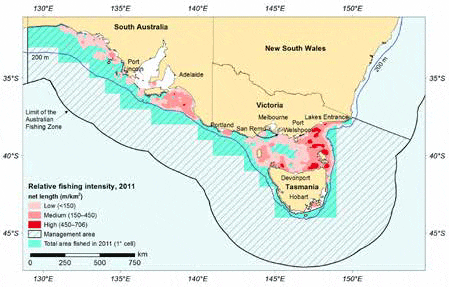
As part of the SESSF, the GHTS is managed using a system of output controls with individual transferable quota (ITQ). Quota was first introduced for blue-eye trevalla in 1998, and was then extended to all quota-managed species except some species of shark in 2001. ITQs for school and gummy shark were also introduced in 2001, and ITQs for elephantfish and sawshark were introduced in 2002. In 2006, as part of the Securing Our Fishing Future structural adjustment package, 26 gillnet boat statutory fishing rights, 63 scalefish hook boat statutory fishing rights and 17 shark boat statutory fishing rights were removed.
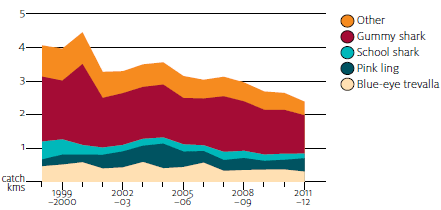
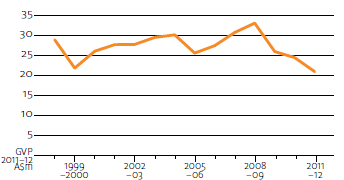
Gillnets are used to target shark species (mainly gummy shark), while all other methods are used primarily to target finfish species, with some targeting of shark species using line methods. The main target species in the sector include gummy shark, pink ling and blue-eye trevalla; school shark has historically been a target species but is now managed as a byproduct species. Together, these four species accounted for 91 per cent of the sector’s gross value of production in 2010–11 (Figure 3) (ABARES 2012).
The median age of skippers surveyed in the sector was 42 years in 2010–11. Skippers had a median of 24 years of fishing experience and 17 of these were spent in the GHTS. Half of respondents had a higher educational attainment than year 10.
Financial performance
The survey population for a given year was defined as any boat that recorded more than 1 tonne of catch in the GHTS in the survey period. The population was 68 in 2009–10 and 73 in 2010–11. The sample was 16 in both survey years, representing 22 per cent of the population in 2010–11 and 39 per cent of the catch. The small sample size should be considered when drawing conclusions from these results.
Some operators in the GHTS are likely to have operated in other fisheries during the survey period. These have been included in their financial performance results. The financial performance of the average boat operating in the GHTS deteriorated from 2009–10 to 2010-11 (Table 11). Total revenue declined in percentage terms, marginally more than total costs (7.3 per cent compared with 7.2 per cent), resulting in a slightly lower boat cash income. Depreciation rose marginally, resulting in a further decline in boat business profit, falling by $3500 to $8300 in 2010–11. This resulted in profit at full equity of $86 000 in 2010–11, down 6 per cent from 2009–10.
Total cash receipts declined by $37 000 to $466 000 in 2010–11, reflecting an 8 per cent reduction in seafood receipts which was only partially offset by a 5 per cent increase in non-fishing receipts. Total cash costs declined by $34 000, to $438 000. Crew costs, which accounted for the largest share of cash costs (32 per cent in 2010–11), fell by 5 per cent and fuel costs (12 per cent) remained relatively constant, rising by less than 1 per cent. Repairs and maintenance (7 per cent) fell by 13 per cent.
In 2010–11 gillnet operators appear to have had relatively similar cost structures to other GHTS operators. Gillnet operators had 5 per cent lower total cash receipts and 3 per cent lower total cash costs than the average of all operators in the GHTS. This resulted in all profit categories for gillnet operators being lower than those for the sector as a whole.
Timelines of the Gillnet, Hook and Trap Sector, 1998–99 to 2011–12
Economic performance
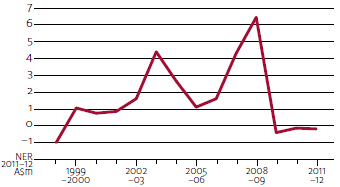
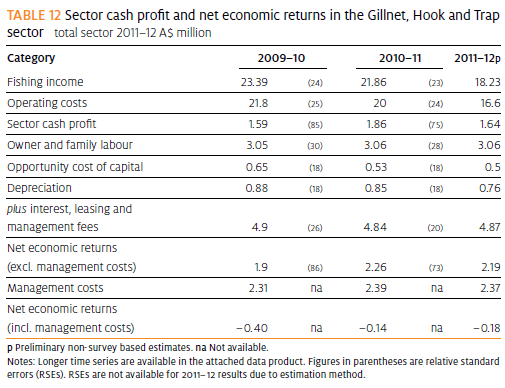
Fishing income and operating costs in the GHTS fell in all three of the years considered (Table 12). Net economic returns (NER) including management costs increased by around $266 000 between 2009–10 and 2010–11 but remained negative at –$137 033. This was due to fishing income decreasing at a lesser rate (7 per cent) than operating costs (8 per cent). This led to an increase in sector cash profit of 17 per cent. A decrease in the opportunity cost of capital and depreciation and little change in management costs resulted in an increase in NER in 2010–11.
In 2011–12 NER were estimated to fall only slightly to –$182 000. Both fishing income and operating costs are estimated to fall by 17 per cent.
Between 2009–10 and 2010–11 there was very little change in total effort; however, there was a 1 per cent reduction in both catch and prices which reduced fishing income. This is likely to have put downward pressure on costs (especially crew costs, which are highly correlated with fishing income) resulting in lower operating costs in the sector. NER improved marginally in 2010-11 but remained negative. This trend continued in 2011–12 with total fishing effort and catch falling, resulting in lower fishing income and lower operating costs and NER remaining relatively unchanged compared with 2010–11.
It is estimated that NER became negative in 2009–10 for the first time since 1999–2000, and remained negative in 2010–11 and 2011-12. Gummy shark abundance, availability and price are the main driver of costs and revenues in the sector. In 2009-10 voluntary closures were implemented in the sector to protect Australian sea lion populations. At the beginning of 2010-11 sea lion closures became mandatory in the waters of South Australia (AFMA 2010) and were much larger than the voluntary closures previously in place. These closures, which excluded fishers from some areas previously fished for gummy shark, potentially reduced gummy shark availability and coincided with the period in which NER became negative. It is likely that the economic performance of the sector was constrained by these closures. Further analysis would be required to understand the full effects of these management changes on the sector’s economic performance.
Management efforts to rebuild school shark stocks that are currently classified as overfished may also have affected recent economic performance in the GHTS. The total allowable catch (TAC) for school shark has progressively been reduced to historically low levels to promote rebuilding. Given that school shark is often caught as bycatch when targeting gummy shark, gummy shark catches may be constrained by lower school shark TACs.
The above issues demonstrate management efforts to address issues around bycatch and ecosystem impacts can have significant implications for the economic performance of fisheries. This further demonstrates the importance of using economic information to inform such management changes so that preferred management outcomes can be achieved at least cost for industry, and society more broadly.
August 2013

