Summary of Findings
Virginia Oyster (Crassostrea virginica) Aquaculture 2005-2010
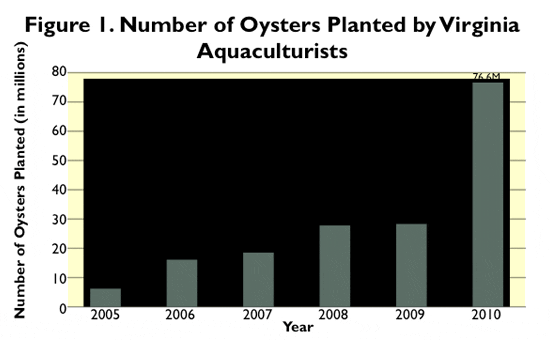
The oyster industry continues to evolve from the traditional extensive planting of shell on bottom to more intensive, contained, aquaculture utilizing cages, racks, floats, and the like. As is depicted in Figures 1 and 2, the growers surveyed reported substantial expansion in oyster aquaculture from 2009 to 2010. A nearly three-fold rise in oyster plantings occurred from 2009 to 2010, the largest single year increase since the spike in plantings from 2005 to 2006.
The nearly seventy seven million oysters planted in 2010 exceed the fifty percent increase predicted by growers in last years survey by thirty four million oysters. Expectations reported by growers in this survey for 2011 plantings estimate an additional increase of 1.8 million oysters.
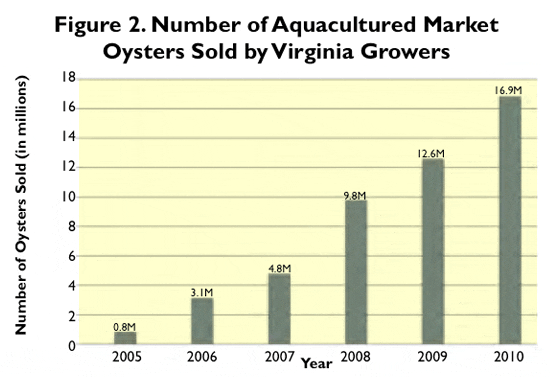
The numbers of market oysters sold by Virginia growers increased in 2010 by 34 per cent to almost seventeen million. This is similar to the increase reported from 2008 to 2009, which was 29 per cent. If the growers expectations indicated in this survey materialize, more than twenty nine million cultured market oysters will be sold by Virginia growers in 2011 (a 74 per cent increase). Combining the overall sales of single, market oysters with the weighted average price per oyster it is estimated that the total revenue for oyster aquaculturists (not including spat on shell production) is $5 million.
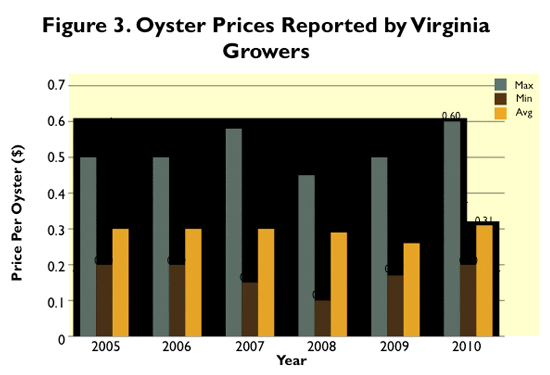
For the purposes of this report, oyster prices are not broken down as to market segment (i.e. primary wholesale, secondary wholesale, retail, etc.). The data in Figure 3 show continued stability in the average prices received for cultured oysters over the five-year period while volume of sales have continued to expand.
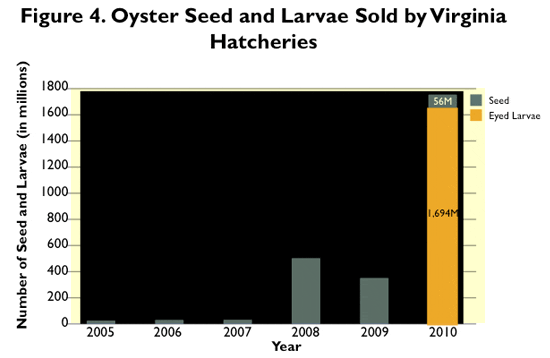
With the expansion of large-scale remote setting or spaton-shell oyster planting in Virginia during 2008 and continuing today, the entire hatchery volume picture changed, as existing firms became active in purchasing not just cultchless seed, but large quantities of eyed larvae for spat-on-shell development.
Remote setting is a method of oyster cultivation in which oyster larvae and old oyster shells are mixed in a controlled environment in large tanks on land rather than in open Bay waters. After the larvae attach or set on the old oyster shells and metamorphose into seed or spat oysters, the resulting spat-on- shell is ready for almost immediate planting in the Bay where the spat will grow naturally until ready for harvest.
The primary advantage of spat-on-shell cultivation is that it requires less labor and fewer materials than single-oyster cultivation, thereby making it a more economically feasible option for producing oysters. Because spat-on-shell cultivation produces oysters grown in clumps (similar to wild-caught oysters), the primary product is oysters for shucking rather than single oysters for half-shell consumption. For this reason, remote setting is not meant to take the place of single-oyster culture (which produces consistent, high-quality, half-shell oysters) but to complement it with a means of producing, on large scale, a local oyster for use by Virginias oyster processors.
The industry forecast for continued growth in use of eyed larvae for spat-on-shell remains. Difficulties in hatchery production in 2009 were reportedly the cause of the decline seen in that year; however significant advancement in the production of both seed and eyed larvae is evident by the surge in 2010 shown in Figure 4. Production of oyster seed and eyed larvae by Virginia hatcheries realized an almost four-fold increase from 2008 to 2010 with the majority being eyed larvae (1.7 billion).
This forecast derives directly from the continued growth in aquaculture of oysters in Virginia, as virtually all of the seed produced is either planted by the hatchery owners themselves in their aquaculture operations or sold to other Virginia oyster growers. This vertically integrated system with eventual sales to many out-of-state consumers adds important economic development to local coastal communities.
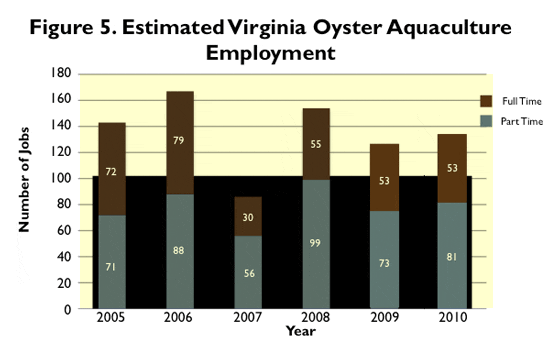
Finally, as shown in Figure 5, Employment associated with oyster aquaculture has remained variable over the recent years. The difficulty of estimating the time and labor associated with relatively small-scale aquaculture conducted in conjunction with other business lines makes estimates of oyster culture labor problematic at this point in industry development. In view of this fact, the trends in these employment igures should be not overly interpreted. There is consistent expectation that with successful development of both spat-on-shell and cultch-less oyster aquaculture, additional employment will be required to meet the greatly expanded planting and production needs.
Oyster growers have adopted the use of improved strains of oyster seed and larvae over the years to optimize growth rates, disease resistence, and meat quality during warmer months. The use of triploid eyed larvae and seed is the overwhelming majority reported by growers. In 2009 and 2010 the percent triploids used in Virginia farms was 80 per cent and 91 per cent respectively. Industry reports that the sterile triploid seed is more viable from a commercial standpoint, as the oysters grow faster and do not diminish in quality with seasonal spawning.
Virginia Clam (Mercenaria mercenaria) Aquaculture 2005-2009
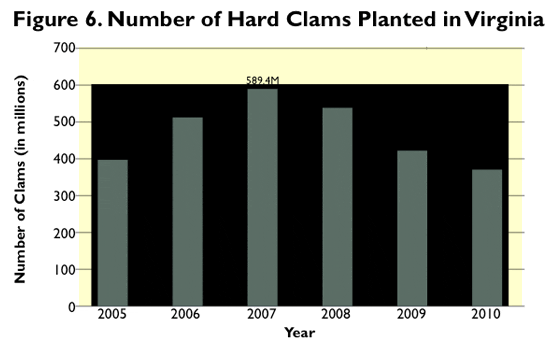
The aquaculture of hard clams in Virginia while expanding from 2005 to 2007 began contracting somewhat in 2008 and has been declining further since 2009. Based upon previous economic assessments compiled by the authors, Virginia leads the nation in the culture of hard clams. While Virginia continues to lead the nation in hard clam aquaculture production, a continued downturn in planting and sales is evidenced by the most recent surveys.
As depicted in Figure 6, for the third year in a row, clam growers reported a decline in seed plantings during the most recent year. The firms reporting indicated that during 2010 they decreased plantings by nearly fifty one million clams (-12 per cent) compared to 2009. The outlook for 2010 was incomplete at the time of the 2009 survey; however, those reporting suggested the likelihood of an increase in their seed planting of 7 per cent during 2010 which is not consistent with the data from this survey.
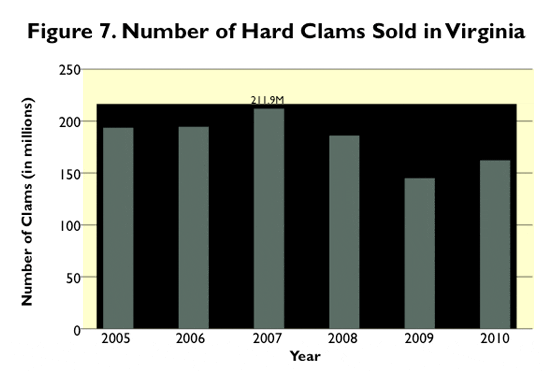
The 2010 crop reporting survey reflects a slight increase (12 per cent) in the total number of Virginia market clams sold between 2009 and the end of 2010. During 2010, it is estimated that Virginias total farm output reached an estimated one hundred sixty two million market clams, as shown in Figure 7 (previous page). Combining the overall sales with weighted average price per market clam it is estimated that total revenue for hard clam aquaculturists in 2010 was $25 milliona slight increase of $3.3 million from the prior year.
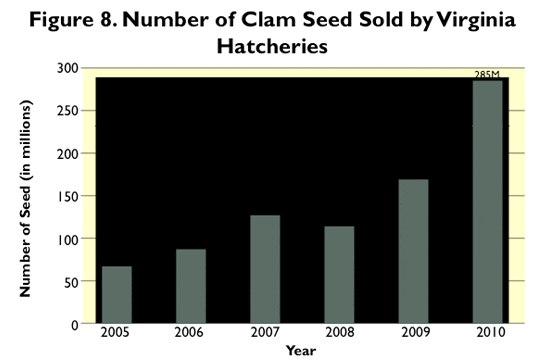
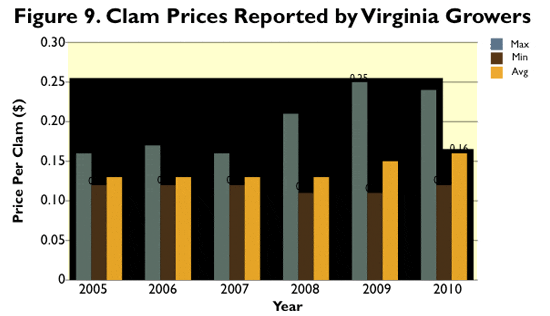
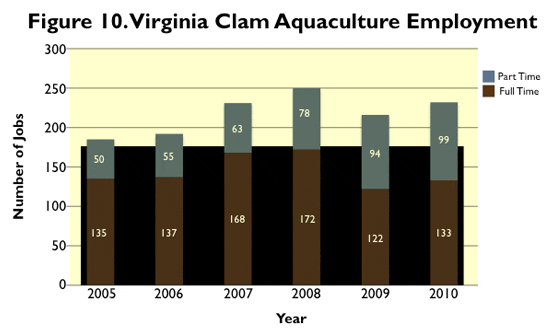
There was an estimated 69 per cent increase in sales of clam seed (Figure 8) in 2010 compared to the prior year; however this survey was the first year specific hatchery data was received, therefore it may be an artifact of that change. Industry sources indicate that much of the hatchery capacity is dedicated to producing seed for the hatchery owners own planting. Essentially, all of the seed produced is planted in Virginia. The reported average price of clam seed was the same in 2010 as it has been in previous years. Figure 9 displays the survey findings regarding relative prices received for market clams. The weighted average price reported per market clam at the farm gate was $.16 during 2010, up slightly from the prior year. Also, as shown in Figure 10, even with reported contraction at the farm level both levels of employment showed a slight increase. Full time employment increased 5 per cent and part time personnel increased 9 per cent during 2010.

