Production of fishmeal
The fishmeal production process and value chain
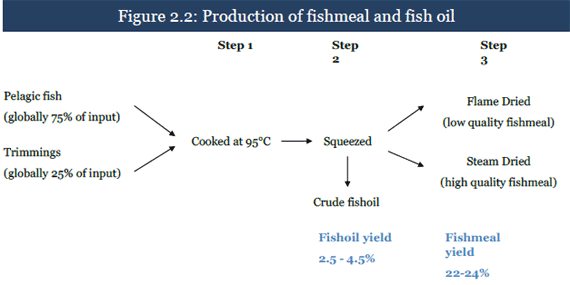
Fishmeal is a brown powder obtained after cooking, press drying and squeezing fresh raw fish or trimmings from food fish. IFFO has estimated that in 2009 pelagic fish was used in 75 per cent of all fishmeal production, while the remaining 25 per cent came from trimmings. Pelagic species are ocean fish that swim in schools and live in the upper sea levels. Their source of food is mainly plankton and most pelagic species are considerably fattier than other fish species. Historically, landings of fish have been around 90 million tons p.a. and about 1/3 of this has been converted into fishmeal and fish oil, while the remaining 60 million tons are marketed as fresh, frozen and canned fish.
Fishmeal contains typically 60 to 72 percent protein, 10 to 20 percent ash, 5 to 12 percent fat and has a high content of the fatty acids EPA and DHA; more commonly referred to as long chain omega-3s (IFFO 2011).
Fishmeal in its basic form has been produced for centuries and usage has varied from production of fertilizers to salmon feed. Nowadays, fishmeal is used primarily in feed production. Fishmeal and fish oil production has become a thriving industry as both fishmeal and fish oil prices have soared (see figure 5.1 for fishmeal price data).
The Peruvian fishmeal and fish oil producer Copeinca has illustrated how the value chain in the industry is formed.
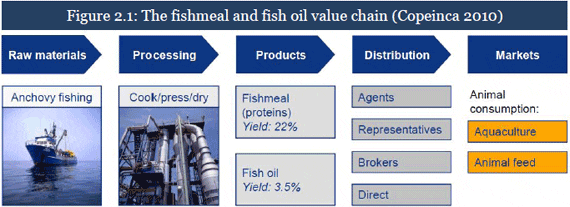
The production process can roughly be described in three steps: First the fish is inspected, cleaned and cooked at about 95 ° Celsius. This process helps sterilize the fish as well as separate out proteins and oils. The cooked fish is squeezed to free most of the remaining liquids, and the material is then dried and ready to be sold (IFFO 2011). Fishmeal can be grouped into four product categories:
- High quality – used mainly for small-scale aquaculture units (eg trout farms).
- Low temperature meal – produced by steam drying, is highly digestible which nurtures rapid growth, and is thus especially suitable in salmon farming and piglet production.
- Prime – meal with a protein count between 66 and 68 per cent.
- Fair Average Quality (FAQ) – flame dried meal with a lower protein count (direct fire causes proteins to disintegrate).
Global production
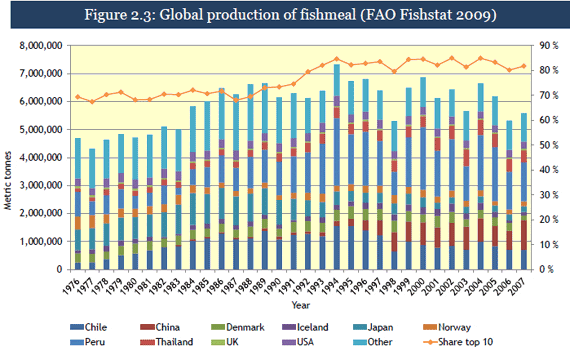
Global production of fishmeal is concentrated around a few top producers; the top ten manufacturers in 2007 made up approximately 80 per cent of the global production. Today Peru is the largest producer, China the second, Chile the third and then the Nordic countries Norway, Denmark and Iceland follow as the most important producers.
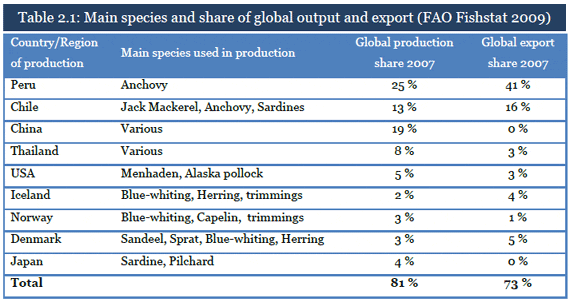
There are approximately 300 dedicated plants worldwide that produce about 6.3 million tons of fishmeal and 1.1 million tons of oil annually from roughly 33 million tons of whole fish and trimmings (FIN 2010). The species used in production vary from region to region, but generally speaking fishmeal consists of small, bony, pelagic fish that have little or no commercial value as fish for direct consumption (FAO 1986). It is estimated that about 90 per cent of the fish species used to make fishmeal is “presently unmarketable in large quantities as human food” (Bose et al 1991). See table 2.1 for an overview of the different species used around the globe.
The global fishmeal output has remained at 6 to 7 million metric tons per annum for the last 20 years, while world trade has averaged around 3 to 4 million tons. Fluctuations in output and export level are naturally linked to variations in landings of fish used for fishmeal production. Overfishing and unsustainable fishery management has caused some of this variation, but the large deviations are mainly due to El Niño events.
El Niño
El Niño is a disruption of the ocean-atmosphere system in the tropical Pacific, which has important consequences for weather and climate around the globe (Philander 1990). A mild El Niño occurs every 2 to 7 years and typically lasts from nine months to two years. Major El Niño events (major meaning long-lasting and/or highly influential) have on average occurred every 26 years (NOAA 2011). El Niño means The Little Boy or Christ Child in Spanish, and this name was chosen since the event arrives most often around Christmas time. Among the consequences are increased rainfall across South America, drought in the West Pacific, and a shift in the Pacific trade winds.
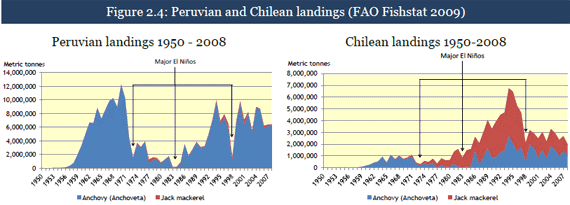
In normal, non-El Niño conditions, the trade winds in the South Pacific blow towards the coast of Australia and Asia. These winds push warm water towards the west Pacific and the effect is so strong that the sea surface is about ½ metre higher around Indonesia than in Ecuador (NOAA 2011). When warm water is pushed away, the laws of physics dictate that it must be replaced by something else and thus deep, cold, nutrient rich water seeps up towards the coast of South America. This process is called upwelling and is what (among other factors) fuels the large schools of fish present around the eastern Pacific (Coull 1993). During El Niño years this nutritious process can collapse and the fish is driven deeper and away from the shorelines of South America. This makes it harder to catch and landings are reduced significantly. With Peru and Chile as the most prominent fishmeal producers in the world (responsible for approximately 40 per cent of the global output), the El Niño can have a significant adverse effect on global supply of fishmeal.
South American fisheries
El Nino's destructive force on South American fisheries becomes apparent when viewing historical landings in Peru and Chile. From 1950 to 2008 there were three major El Ninos: 1972/73, 1983 and 1998, and fishery landings were reduced by 50 to 90 per cent compared to the year before. Historically, overfishing has been a big problem in South America and combined with an El Nino event it nearly depleted the anchoveta schools during the 1970s. The stocks recovered throughout the decade, but overfishing caused a man-made stock cycle that coincided with a major El Nino in 1998 and once gain almost eradicated the anchoveta. After 2000 improved regulatory fishery schemes have been introduced in both Peru and Chile, with reduced quotas and increased resources to the fight against poaching of fish.
World trade of fishmeal
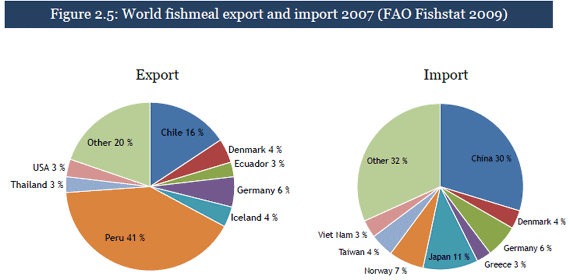
Approximately 60 per cent of world fishmeal production is each year exported and not consumed in the manufacturing country, meaning world fishmeal trade equals about 3-4 million tons each year. Excluding China, which is a net-importer of fishmeal, the world trade share is raised to over 70 per cent. Peru and Chile contribute about 60 per cent of the globally exported fishmeal, and this further underlines the importance of the South American fisheries to the fishmeal market. The statistics show that even though China is one of the world's biggest fishmeal producers, it is also by far the biggest importer of fishmeal with 30 percent of the global trade volume in 2007. Following China are the Asian nations Japan (11 percent), Taiwan (4 percent) and Vietnam (3 percent). The Scandinavian nations and Germany are involved in much intra-European trade (both importing and exporting fishmeal) and their figures should therefore be interpreted with caution.
Consumption of fishmeal by region
As an estimate of consumption, I have used FAO's FISHSTAT database and calculated the following relationship:
Consumption = Production + Import - Export
Factors like country-intermediary storage and lagged/premature dating could cause some of the data to shift to one of the adjacent years in the sample and thus alter the consumption estimate. These effects are however considered negligible in most of the years, and not affecting the goal of providing a presentation to the biggest fishmeal consumers in the world.
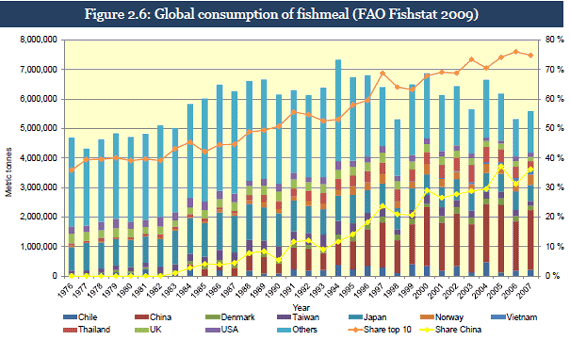
Like global production of fishmeal, global consumption is to large extent concentrated around some key players. China is by far the greatest consumer, with a fishmeal consumption level ranging in between 1.6 and 2.0 million metric tons (MMT) annually. Japan then follows with a consumption of about 0.7 MMT, Thailand with about 0.4 MMT and Norway has around 0.35 MMT annually. China has been the main driver for the increasing consumption concentration, as they have gone from consuming 3 per cent of world fishmeal production in 1985 to nearly 40 per cent in 2007. As China imports around 1.2 MMT fishmeal annually (around 1/3 of total world trade) their demand is a significant factor in the forming of fishmeal prices.
Consumption by sector
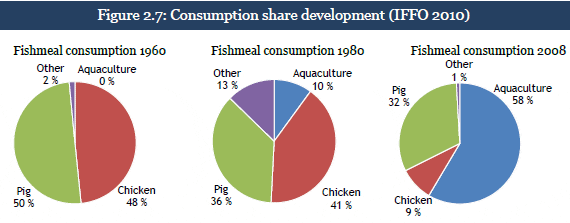
As mentioned in the introduction, fishmeal has historically been used for several different purposes. In the 1960s fishmeal was used almost exclusively in pig and poultry production as the high protein content combined with health enhancing acids provided rapid and stable biomass growth (see figure 2.7 for an illustration of the change in consumption structure). From the 1960s onwards the aquaculture sector expanded production and thus its share of world fishmeal production rose (development in aquaculture farming production showed in appendix figure A.1). Since fishmeal has a high content of nutrients particularly favorable in aquaculture production, eg omega-3 acids (IFFO 2005 and Connor 2000), aquaculture farmers attach a higher premium to fishmeal over vegetable proteins, than what pig & poultry producers will do.
Therefore, the tilting towards a larger fishmeal consumption share for the aquaculture sector is not only driven by the expansion of the sector itself, but also because it compared to pig & poultry producers has poorer substitution options.
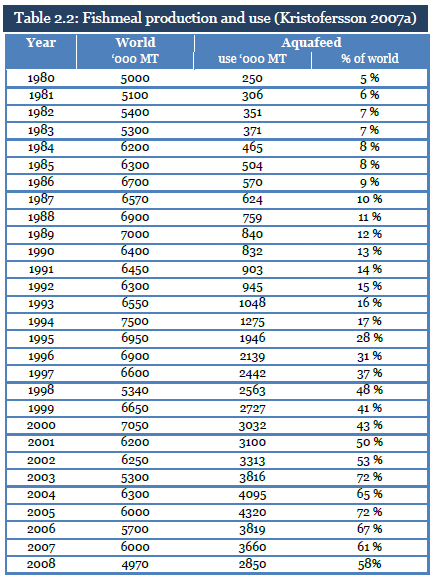
From the 1960s the aquaculture sector has grown into by far the most important consumer of fishmeal. A more detailed view of the dynamics in this change can be obtained by viewing consumption share data gathered from fishmeal research papers which is listed in table 2.2.
Aquaculture's share of about 10 per cent remained stable throughout the 1980s, before it increased fourfold over the next decade. A drop in 1998, which coincided with a major price hike in fishmeal prices, was followed by further increments in the consumption share. These numbers are interesting when it comes to understanding the dynamics behind the trade and valuation of fishmeal.
January 2012

