Overview of Italian fisheries
In 2004 the Italian fishery industry represented about 0.1% of Italys Gross Domestic
Product. The importance of the industry has declined constantly over the last three decades,
largely due to a reduction in fish stocks and the subsequent limitations placed on fishing. In
2004 Italian fish catches represented almost 5% of the total EU25 production, but over 50%
of the EU25 take in the Mediterranean. The breakdown of the countrys 2004 production, by
source is detailed in the following table:
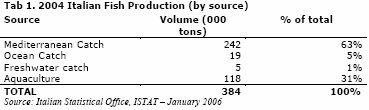
The Mediterranean Sea catch and aquaculture account for most of Italian production, while freshwater catch and the ocean catch are much less significant.
Marine catch
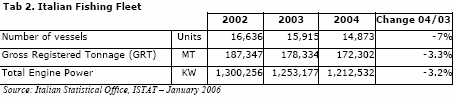
Italy has about 8,000 kilometers of Mediterranean coast, off of which almost 15,000 vessels
operate for a total Gross Registered Tonnage (GRT) of over 172,000 tons and a total engine
power of 1,212,532 kw (2004 data).
About 60% of the fleet is composed of boats for small fisheries, 21% trawlers, 9% multipurpose
boats and 5% hydraulic dredges. Total 2004 marine production was down by 2%
from 2003, mainly because of sharp decreases in landings of mollusks and shellfish.
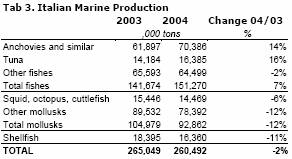
Southern regions, especially Sicily, were the most affected by the decrease in production.
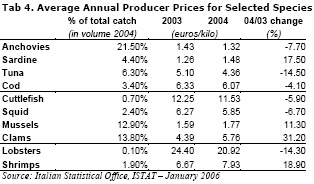
Average producer prices increased for sardines, shrimp, mussels and clams, while prices for
both tuna and lobster experienced sharp decreases.
Freshwater fisheries
Freshwater production in 2005, albeit small, increased more than 17%, to over 5,000 tons, from less than 4,500 tons in 2004. Caspian-sand smelt and other small fish accounted for about 50% of the total caught, trout and other similar fish accounted for about 20%, with the remainder consisting of eels, carp, tench, and others. Central and northern regions (especially Lombardia, Piemonte and Umbria) accounted for a large share of the production and for most of the production growth of 2004.
Aquaculture
Fish farming in Italy has gained importance over the last decade, but its development is
constrained by environmental concerns, lack of area with adequate characteristics, and an
uncertain corporate tax regime. Aquaculture production in 2004 was down 14% from 2003,
mainly due to a reduction in mussels and clams.
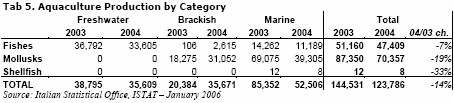
The main species produced by aquaculture are mussels (35%), trout (26%), clams (24%), bream (5%), and bass (6%).
Processing
The number of companies involved in processing in Italy has constantly declined over the last
two decades. According to official data from the last industry census of 2001, there are 415
fish processing entities left in the country. These account for less than 1% of the value
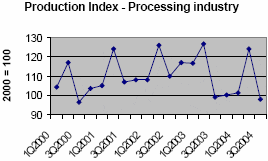
added and less than 2% of the Italian labor force employed in the food industry. According to the production index provided by the Italian Food Industry Association, Federalimentare,
production of processed fish products slowed during the second half of 2003 and in the third
quarter of 2004.
Tuna canning, with about 91,000 tons processed in 2005, accounts for about 70% of the value of the processing sector. Canning sardines in oil (about 2,000 tons), anchovies in salt (12,000 tons), fillets of anchovies in oil (9,000 tons), processed clams (2,400 tons), and others (16,000 tons) are the rest of the sector. The tuna canning industry has gone through a sharp operational downsizing in the last decade as large companies invested in countries with a larger availability of raw material for processing. Italian processors believe that the tuna quota allocated by ICCAT to Italy for blue fin tuna is too low to supply the national industry. The 2005 wholesale value of canned tuna production was about 415 million (about 500 million dollars). Tuna processing is expected to rise in the future as companies are trying to develop new markets for products, such as mixes for salads and ready meals.
Consumption
Total Italian 2005 household consumption of fish products was about 424,000 tons, up
almost 2% over 2004, with an increase in value of a little more than 1%. While the average
prices for most unprocessed or slightly processed categories were down, they were up for
ready-to-cook products.
Consumption trends for raw, fresh, or defrosted, freshwater fish are on the rise, especially
for white trout (+11%) and salmon trout (+20%), while consumption of eel is declining (-
10.6%). Consumption of mussels is up by over 5%, octopus over 7%, and squid over 13%,
while consumption of both salmon and clams is down by more than 4%. Sea fish
consumption remained stable between 2004 and 2005, considering adjustments for species
availability. Consumption of shellfish declined about 5%, mainly because of reduced
consumption of prawns (-3.4%) and scampi (-26.8%).
Consumption of ready-to-cook frozen products grew by more than 7%, thanks to fillets and
fish fingers. Consumption of other processed categories remained stable. Canned tuna
consumption grew by more than 6%, while consumption of canned tuna in oil decreased by
1%. Smoked salmon consumption grew by more than 11%.
Trade
Total 2005 Italian imports of fishery products, both fresh and processed, increased by 2% in volume and 6% in dollar value. Most of the increase went to EU25 countries. U.S. exports were up 10% in dollar value, despite a 10% reduction in volume, which means a higher average value of exported products. On the export side, the trend remained stable, with some growth in the EU25 area.
Policy
According to the Ministry of Agricultural and Forestry Policies, a recent deal between
European member states secured EU funding for Italian fisheries in the amo unt of 376
million (at 2004 value), or approximately $470 million, for the period 2007-2013. This
represents 10% of the European Fisheries Fund. According to official estimates, this holds
the level of EU funding constant from the previous 2000-2006 programming period, and is
considered a success for the industry since they feared that enlargement of the EU would
reduce the Italian share of the European fund. In addition to the EU resources, Italian
national resources provided 32 million ($40 million) through the National Program for
Fisheries and Aquaculture.
Measures financed through the plan include support to
associations (7.7 million), support to companies (2.7 million), support to market research
(1.6 million), and support for R&D (1.2 million). Beginning in 2006, the Government of
Italy will also apply a reduced VAT rate to fish products (7% vs the 20% standard rate) at an
estimated annual public budget cost of 12 million per year.
Controls on illegal fishing practices
In 2005 the Italian Coastguard conducted 30,000 boat inspections and 166,000 market and landing point inspections, seizing 800 kilometers of drift nets, 250 tons of products obtained through illegal fishing practices, and 3,000 pieces of various illegal equipment. The Coastguard reported 925 criminal offences and 4.166 non-criminal procedures, finding the most common practices to be the mislabeling of previously frozen product as fresh and the mislabeling of species.
Further Information
To read the full report please click here (PDF)
Source: USDA Foreign Agricultural Service - April 2006
