A Difficult Year Ahead?
Since mid April cracks have appeared in the global economy,
with a lacklustre tone evident in the local economy. Quarterly
movements in surveyed unemployment has been volatile of
late, with unemployment beneficary numbers dipping and job
advertising indicating a more modest recovery in the demand
for labour.
A large fall in the latest retail trade volumes revealed
an unwinding in the rugby World Cup-induced boost in cash
spending. This is a clear negative for quarter one GdP, which is
expected to be partly offset by climbing manufacturing sector
activity. A good start to the year for manufacturing sector activity
was evident in good primary production and encouraging export
statistics. however, the large fall in the April PmI (performance
of manufacturing index) figures suggests that the still high kiwi
dollar, a wobbly global scene and delays with the Canterbury
rebuild are likely to contribute to a difficult year ahead.
Two of the key potential transmissions mechanisms to the
New Zealand economy; namely funding and commodity
prices, have provided more positive signs. The NZ dollar has
started to play catch-up, reconnecting somewhat with falling
commodity prices. Technically, the New Zealand dollar doesnt
look extended at all based on where commodity prices currently
are (still high by historical standards). however, this does not
allow for the fact that a sizeable chunk of the export sector is
not benefiting from high commodity export prices (particularly
services and manufacturing).
Commodity prices fell sharply in April, to sit at an 18-month
low. Sheepmeat and wool prices dropped to 18-month lows.
International dairy prices have retracted back to the level that
prevailed in August 2010. historically, the aggregate level of
commodity prices are 12 percent higher than the 2000-09
decade average, propped up by meat and dairy prices. however,
the sub-groups of seafood, forestry, aluminium and horticulture
prices are below period averages.
What Will Grow the Economy?
An important pre-condition to the economy strengthening
this year will be for consumer sentiment to start marching to
the more upbeat tune already evident in business confidence
gauges. With the housing market data appearing to have paused
for breath and with mother Nature having already leant support
to the rural sector, the economy is looking devoid of a real
economic engine in the second half of the year. much depends
on business investment and the Christchurch rebuild as growth
engines over the next 12 months.
Specifically, it is uncertain times for commercial fishing in New
Zealand but the outlook is promising. more recently, the New
Zealand dollar has moved towards a more competitive level; and
an increasing share of the national catch is being exported to
developing markets, which have been relatively insulated from
the European sovereign debt crisis.
Export Statistics
Export NZ$Free On Board
All figures in this section are based on export data provided by Statistics New Zealand and analysed by the New Zealand Seafood Industry Council. Please note that the results for January, february and march (Q1) 2012 are provisional.
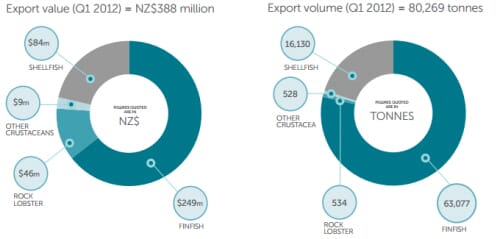
Export Tonnes
Exports of finfish species accounted for 64 percent of all seafood exports in dollar terms yet represent 79 percent of tonnes sold. While we export slightly more than 2,000 tonnes of rock lobster a year (about one percent of all catch), this species contributes around 14 percent to export earnings, although the contribution is down slightly in the first quarter as most rock lobster is caught towards the end of the year.
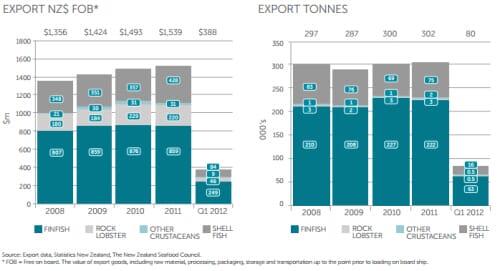
Export earnings in Q1 were up 8.6 percent compared with Q1 2011. Volumes were also up albeit to a lesser extent at 3.2 percent.
The volume and value of other crustaceans (mainly crab, shrimps and prawns) grew strongly between years, up 59 percent and 41
percent respectively.
The total quantities exported fell somewhat as the world came to grips with economic crisis but have seen positive
growth over the last couple of years. Export volumes grew by 3.2 percent in Q1 2012 compared with the first quarter of 2011
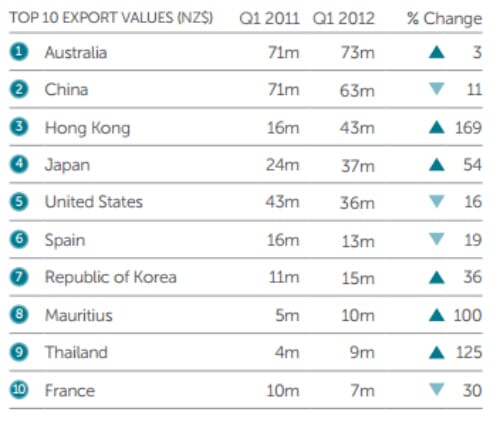
Seafood Exports by Country
At the end of 2011, China became our leading export partner; it
was our fifth highest export partner in 2003. The large increase
in exports to China was matched by a similar decrease in exports
to hong Kong in 2011. however, hong Kong has seen a strong
start to the year with a 169 percent increase in sales compared
with the same time last year the majority of their imports have
been in rock lobster ($29m).
We have also seen the emergence of some smaller trading
partners this year, namely mauritius and Thailand while some
of the more established countries China, uS and Spain have
dropped in sales compared with the same time last year.
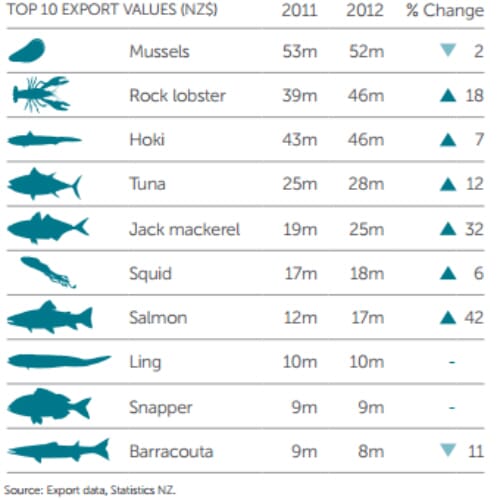
Exports by Species
We catch more hoki than any other species, but in dollar per
kilo terms we earn more from the export of many other species
especially shellfish and crustaceans.
As catch varies significantly across the year the rankings
of these species may vary each quarter. The important
comparison is between quarters in 2011 and 2012. overall, we
saw growth in sales value of most of the top species apart from
a slight decline in mussels. ling and snapper remained stable
while barracouta dropped by 11 percent. This was due to a
significant drop in catch from five tonne to three tonne.
Exports of Main Commodities
Exports of fish, crustaceans and molluscs totalled $347m for the
first quarter of 2012, an increase of 8.7 percent compared with
same period last year. This is a positive increase given that total
exports across all merchandise fell by 1.9 percent.
As well as the $347m attributed below, the seafood industry also
exported approximately $41m in processed products such as
capsules, powders, fish cakes and fingers and other value added
products.
International Statistics
- The UN FAO reported in 2011 that the global trade in
fish and fish products set a new record with exports
reaching US$127 billion, an increase of almost 17
percent from the previous year. The main reason
is higher prices on many of the most traded fish
commodities as volumes traded only increased by 0.5
percent. Strong demand in Asia, increasing importdependency in the uS and the Eu but also buoyant
demand from many emerging markets underpinned
the rise in prices. higher prices also reflect higher in-put
costs, for example fuel and fishmeal.
- Exports for 2012 are forecast to total uS$138b, an
increase of 9.4 percent compared with 2011. despite
slow economic growth and reduced purchasing power
in many of the traditional key import markets such
as Spain, Italy and france, demand for seafood is
strong overall.
- The FAO fish Price Index suggests that fish prices will be 4 percent higher in 2012 than in 2011. rising energy and feed costs are likely to keep fish prices high during the year, especially as alternative protein sources such as meat, are influenced by the same factors.
-
fish contributes to food security in many regions of the
world. Numerous developing countries rely on fish as a
major source of protein; in 28 of them, fish accounts for
over 40 percent of animal protein intake.
- New Zealand produces less than half a percent of the worlds seafood supply, but we contribute more than double that in terms of world export dollars.
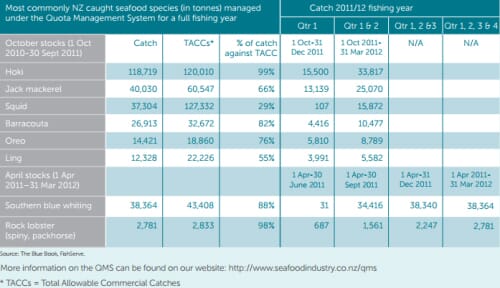
Catch Information
The table below shows the fish species with the largest
Total Allowable Commercial Catch limits for the october
and April fishing years. hoki has the second highest
total TACC (ie. when each species fish stock is added
together) of the october year stocks. The hoki fishery
has a seasonal peak between July and September.
Squid is a highly seasonal fishery in the late summer
and autumn (see graph opposite). It has wide naturally
occurring fluctuations in annual abundance.
other than southern blue whiting, the stocks with an
April fishing year are shellfish and crustacean stocks.
In the last full catch year, hoki and rock lobster were
caught up to their full quota limit. Species such as squid
(29 percent) and ling (55 percent) are considerably under
caught. There are several reasons why this occurs, in
addition to natural fluctuations in abundance noted
for squid. The main one being that while key target
species, such as hoki, are fully caught, the catches of
commercially valuable species associated with the
hoki fishery, such as ling and hake, are caught as a
consequence of that key target fishery and they remain
relatively under caught as a result.
The table below shows actual catch figures against Total
Allowable Commercial Catch levels (TACCs) for the
latest full fishing year (up to either April or october 2011).
The columns on the right show figures for the following
quarters up to march 2012 and will be added to in future
reports as a running record.