The real value of Australian fisheries production has declined at an average annual rate of 4.1 per cent since the start of this decade, reaching $2.2 billion in 2007–08 (Figure 1). Most of this fall is attributed to declines in the value of fisheries production in Commonwealth and state wild-catch fisheries, falling at an average annual rate of 6.9 per cent and 5.8 per cent, respectively, from 1999–2000 to 2007–08. Overall, the real value of aquaculture production fell at an average annual rate of 0.3 per cent over the same period, reaching $868 million in 2007–08.
In recent years, growth in the real value of aquaculture has moderated the overall decline in the real value of Australian fisheries production. Over the period 2004–05 to 2007–08, the real value of aquaculture production grew at an average annual rate of 3 per cent.
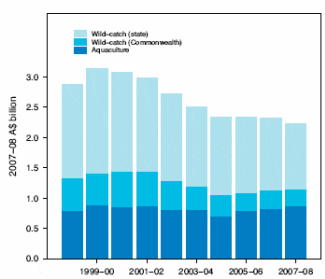
After peaking in 2000–01 at $582 million, the real value of Commonwealth fisheries production has declined by 50 per cent to $288.5 million in 2007–08. This declining trend reflects rises in the cost of fuel, and an appreciating Australian dollar, which has placed downward pressure on domestic and export prices. With increasing costs and a deteriorating competitive position, financial returns from operating in the industry have been negatively affected.
The value of production of major Commonwealth fisheries and key sectors of the SESSF is presented in Figure 2. The SESSF generates the highest value of production of all Commonwealth fisheries. The SESSF is an amalgamation of the following sectors: the CTS, the Gillnet, Hook and Trap Sector (GHATS), the Great Australian Bight Trawl Sector (GABTS) and the ECDWTS. Overall, the GVP for the SESSF was $86.7 million in 2007–08 (Fig. 1.5). In the same year, the NPF generated a GVP of $74.0 million, the highest value of production for a single-method fishery. The ETBF is also important in value terms as it generated $32.0 million in 2007–08.
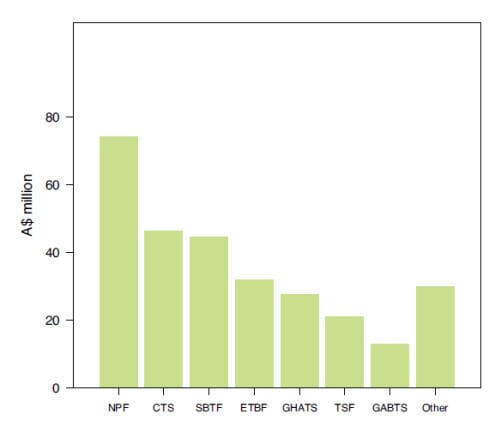
CTS = Commonwealth Trawl Sector; ETBF = Eastern Tuna and Billfish Fishery; GABTS = Great Australian Bight Trawl Sector; GHATS = Gillnet, Hook and Trap Sector; NPF = Northern Prawn Fishery; SBTF = Southern Bluefin Tuna Fishery; TSF = Torres Strait fisheries.
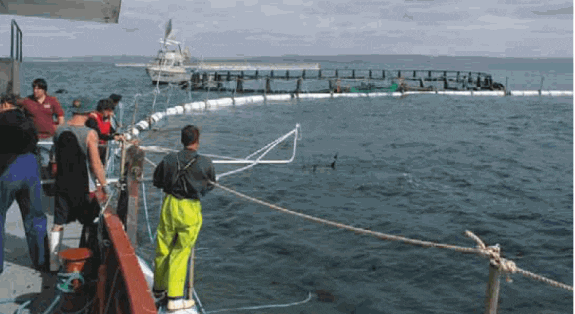
The Commonwealth Southern Bluefin Tuna Fishery (SBTF) is estimated by ABARE to have been worth $45 million in 2007–08. Postharvest aquaculture operations in Port Lincoln (South Australia) resulted in that value growing to $187 million (including Commonwealth SBT farm input).
Employment in commercial fishing, seafood processing and seafood wholesaling
The Australian Bureau of Statistics (ABS) reports two main series relating to commercial fishing employment. Estimates from the Labour Force Survey (part of the Monthly Population Survey) indicate that commercial fishing employment in 2007–08 was 13 000 persons, more than 30 per cent higher than in 2006–07, but around 32 per cent lower than in 2000–01 (Figure 3.).
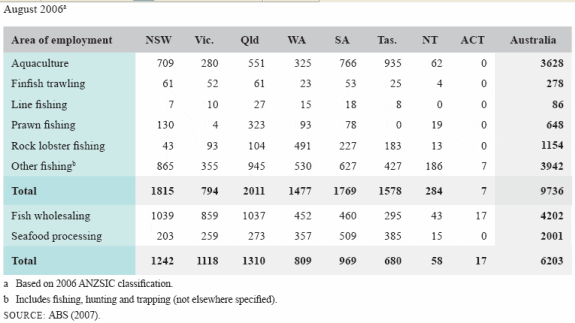
ABS census data from 2006 (ABS 2007) show that commercial fishing directly employs over 9700 people in Australia (Table 1) out of an Australian workforce of around 9.1 million. A further 6203 people work in wholesaling and processing of fisheries products, mostly in fish wholesaling. Of the 9736 people employed in the industry in 2006, more than one-third (3628 persons) were employed in aquaculture and more than 1100 persons were employed in rock lobster fishing, principally in Western Australia and South Australia. Tasmania has the largest share of aquaculture employment, while the fishing industries in Queensland, South Australia and Tasmania each employed around 1300 people. The affiliated industries of fish wholesaling and seafood processing employed 4200 and 2000 people, respectively.
TABLE 1. Estimated employment in the Australian fishing industry, Australian Bureau of Statistics census data, August 2006
Several points should be noted about the ABS employment data. Employment in commercial fishing covers Commonwealth fishing employment and state/territory fisheries and aquaculture. Also, employment data does not give a strong indication of where the incomes of those employed in commercial fishing are spent.
The Fisheries Research and Development Corporation (FRDC) has stated that ‘data collected by the ABS is not disaggregated in sufficient detail to be useful, and tends to under record employees by allocating them to other industries such as transport and generalised food processing’ (FRDC 2004). Hence, the data presented in Figure 3 and Table 1 provides only a broad indication of employment levels in the Australian fishing industry.
Exchange rates
Around 60 per cent of Australia’s fishery production is exported. Consequently, changes in the value of the Australian dollar against the currencies of trading partners affect the value of Commonwealth fisheries production. It is common for the US dollar to be used as the reference price for international trade. An appreciation of the Australian dollar relative to the US dollar reduces the prices received for exports and vice versa.
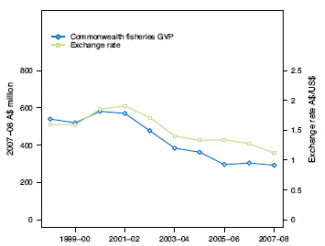
The relationship between the real value of Commonwealth production and recent movements in the Australian dollar is shown in Figure 4. The depreciation of the US dollar relative to the Australian dollar from A$1.90 per US dollar in 2001–02 to A$1.12 per US dollar in 2007–08 (42 per cent depreciation) is tracked in Figure 4 along with the 49 per cent decrease in the real value of production for Commonwealth fisheries. While changes to the exchange rate would not be the only factor contributing to the fall in the value of production, it is likely to have had a substantial impact.
Australian exports of fisheries products
Information about Australian exports of fisheries products is prepared by the ABS. Each product is classified according to the Australian Harmonised Export Commodity Classification system. In most cases this system records each product’s species group and form of processing (such as fresh, chilled or frozen), as well as the originating state or territory and the country of destination. However, using this source of data, it is generally not possible to identify the fishery from which a product was landed. Therefore, in this section, Australian fisheries exports as a whole are discussed; Commonwealth fisheries are not specifically identified.
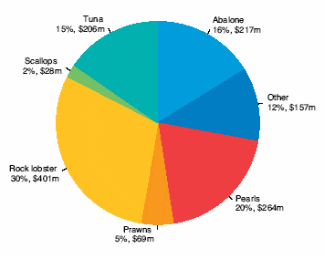
Approximately 80 per cent of the total value of Australian exports of fisheries products relates to edible seafood products. Pearls account for 96 per cent of the value of non-edible exports.
In 2007–08 the main exported products in value terms were rock lobster (30 per cent of gross value of exports), pearls (20 per cent), abalone (16 per cent), whole tuna (15 per cent) and prawns (5 per cent) (Figure 5.).
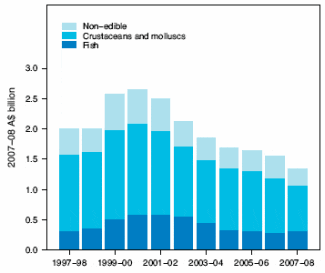
The real gross value of Australian fisheries exports fell by $203 million to $1.34 billion in 2007–08 (Fig. 6.) compared with 2006–07. Over the seven years to 2007–08 the total value of exports fell by 49 per cent in real terms, from a peak of $2.6 billion in 2000–01. Both edible (fish, crustaceans and molluscs) and non-edible fisheries exports declined in value over this period, by 49 per cent and 50 per cent, respectively.
As a relatively small producer of fisheries products, Australia receives prices for seafood exports that are set predominantly on world markets in foreign currencies. There have been a number of factors at work lowering the export value of Australian fisheries products since 2000–01. First, the volume of exports of edible fisheries products has fallen by 32 per cent since 2000–01 to around 44 000 t in 2007–08. Second, prices of fisheries products on world markets have generally fallen. Third, the Australian dollar appreciating against the currencies of major trading partners has further reduced the prices received by Australian exporters. The general decline in the prices of major fisheries commodities exported from Australia to Japan (a major market) since 2000–01 is shown in Figure 7.
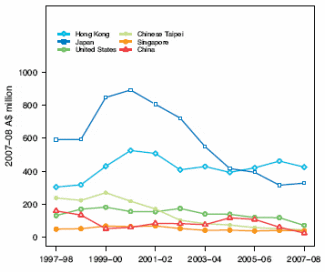
In 2007–08, Hong Kong continued to be Australia’s main export market for edible fisheries products after overtaking Japan in 2005–06 (Figure 8). In value terms, 42 per cent of Australia’s edible fisheries products were exported to Hong Kong ($426 million) and 28 per cent were exported to Japan ($328 million).
The United States is Australia’s third largest export destination, followed closely by Chinese Taipei and China. In 2007–08, these five markets accounted for 88 per cent of the value of Australia’s exports of edible fisheries products (Figure 8).
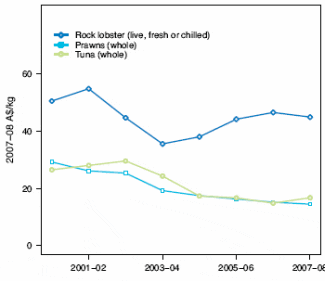
Over the six years to 2007–08 the total value of Australia’s seafood exports to Japan fell by 63 per cent in real terms (2007–08 dollars) to $328 million in 2007–08. This was caused largely by substantial reductions in the volume of exports of key products (rock lobster, prawns and other fish) and the appreciation of the Australian dollar relative to the Japanese yen, the effect of which has been compounded by declining yen prices for key export species, particularly prawns. For example, declining yen prices for prawns combined with the appreciation of the Australian dollar relative to the yen over that period, has resulted in the real price of prawn exports declining by 52 per cent (Figure 7).
Australian imports of edible fisheries products
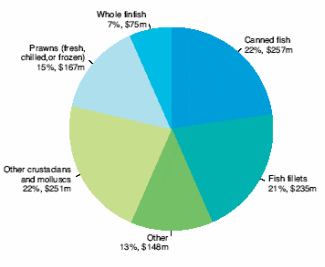
Australian fisheries products compete with imported products on the domestic market. The value of Australian imports of edible fisheries products decreased by $119 million to $1.4 billion in 2007–08, which is equivalent to approximately 64 per cent of the value of Australian fisheries production. More than 80 per cent of the gross value of imports was edible fisheries products, with pearls accounting for 63 per cent of non-edible imports. The main edible products imported into Australia were canned fish (22 per cent), fresh, chilled or frozen finfish fillets (21 per cent) and prawns (fresh, chilled or frozen; 15 per cent of the gross value of edible seafood imports) (Figure 9).
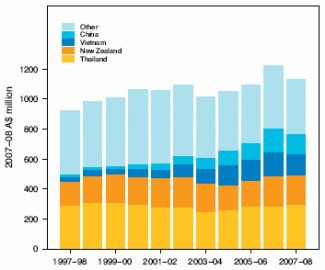
Thailand, New Zealand, China and Vietnam were the major sources of edible fisheries products imported into Australia. In 2007–08, imports from these four countries accounted for 68 per cent of total edible imports by value (Figure 10). Over 70 per cent of Australia’s imports of canned fish, 25 per cent of fresh, chilled or frozen prawns, and 28 per cent of canned crustaceans and molluscs were sourced from Thailand. New Zealand was the source of 33 per cent of Australia’s imports of fresh, chilled or frozen fish products and 17 per cent of fresh, chilled or frozen mollusc imports. In recent years, the gross value of imports from China and Vietnam has grown steadily. China and Vietnam were the source of 29 per cent and 26 per cent of fresh, chilled or frozen prawn imports, respectively. Also sourced from China were 34 per cent of fresh, chilled or frozen mollusc imports.
The volume of edible seafood imports decreased slightly in 2007–08. Over the past five years the volume of edible seafood imports rose by 37 per cent from 144 409 t in 2001–02 to 198 500 t in 2007–08. Of particular note was the increase in prawn imports from China and Vietnam and imports of frozen finfish fillets from Vietnam. The volume of fresh, chilled or frozen prawn imports from China increased from 384 t in 2001–02 to 5486 t in 2007–08, while the volume of fresh, chilled or frozen prawn imports from Vietnam increased from 1842 t to 4856 t over the same period. Frozen finfish fillets from Vietnam also rose steadily from 1447 t in 2001–02 to 14 283 t in 2007–08.
The appreciation of the Australian dollar relative to trading partners’ currencies from 2001–02 to 2007–08 reduced the price Australians paid for imported fisheries products. This increased competition from overseas suppliers has affected the prices received by Australian producers on the domestic market.
Fuel prices and fishing costs
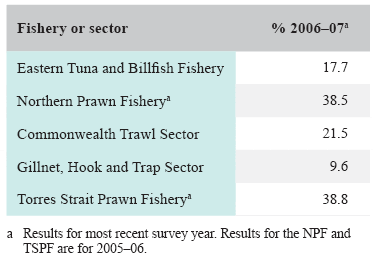
Results from ABARE’s fishery surveys indicate that fuel is a major cost of fishing, ranging between 10 per cent and 39 per cent of the total costs of operating a vessel, depending on the fishery (Table 2). In the NPF and the Torres Strait Prawn Fishery (TSPF), the proportion is high, at 38.5 per cent and 38.8 per cent, respectively. This reflects the longer distances travelled and that trawling is relatively fuel intensive.
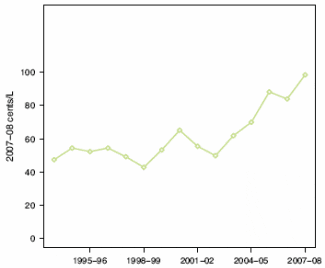
Increases in world oil prices in recent years have caused diesel prices to increase. The average wholesale diesel price (given in Figure 11.) rose from 100 cents per litre in 2002–03 to 141 cents per litre in 2007–08. Fishers are entitled to a rebate on their fuel expense under the Energy Grants Credit Scheme (Commonwealth of Australia 2006). For claims made after early January 2006, the rebate was approximately 38 cents per litre.
Environmental issues
Fishing has an impact on the environment. The type, significance and frequency of impacts on the ecosystem vary greatly with each fishery, fishing method and the time and area within which each individual fishing operation occurs. Some fisheries are also known to interact with threatened, endangered and protected (TEP) species. As a consequence, the environmental management of fisheries attracts substantial community scrutiny, and there are a range of statutory obligations that are placed on fishers and management agencies to ensure fishing practices are sustainable and publicly acceptable.
An assessment of the environmental status of fisheries has not been a major focus of the BRS Fishery status reports in the past. Historically and in this edition, an overview only has been provided on fishery-specific environmental issues. The Australian Government takes an ecosystem-based approach to fisheries management, which requires a move away from the traditional target-species driven management focus to a more holistic approach that considers a wider range of fisheries impacts. To support this move, in future editions it is intended that a more rigorous approach be taken to assessing fisheries against established environmental management performance measures; for example, an increasing focus will be placed on assessing fisheries against the specific ecosystem requirements detailed in fisheries management plans and bycatch and discarding work plans.
It is worth noting that the management of environmental issues relating to fisheries, such as bycatch, and impacts on habitats and the broader ecosystem, are being increasingly incorporated into fisheries management and assessment of Commonwealth-managed fisheries. A legislative and policy basis for this is provided by the ecologically sustainable development objective of the Fisheries Management Act 1991, the Commonwealth Policy on Fisheries Bycatch (DAFF 2000), the assessment of fisheries under the Environment Protection and Biodiversity Conservation Act 1999, and more recently in response to the 2005 Ministerial Direction. Australia is also party to a range of international fisheries and conservation agreements that place environmental management obligations on Australian fisheries.
In 2007, AFMA established a bycatch and discarding programme to provide additional resources and direction to pursue policy and legislative objectives in this area. The programme’s initial direction has been to mitigate impacts on high-risk and TEP species, and also to reduce discarding of target and quota species ‘as far as is practically possible’. A key feature of the programme is the development of annual bycatch and discard work plans. The work plan approach is purported to differ from past approaches in that it is supported by dedicated resources and aims to work more closely with industry and other stakeholders. A more targeted, open and transparent process will greatly assist the development and maintenance of baseline data and the identification of information gaps.
Defining what constitutes ‘high-risk’, nontarget species and determining which species are at risk has been the focus of a joint AFMA and Commonwealth Scientific and Industrial and Research Organisation (CSIRO) project to conduct ecological risk assessments (ERAs) of Commonwealth-managed fisheries. This research is aimed at identifying the risk that fisheries pose to non-target species and ecosystem components affected by fisheries, and is being used to identify management priorities. The project began in the early 2000s and over the course of 2009 it is expected that AFMA will publicly release the outcomes of many of the ERAs. December 2008 saw the release of the first ERA report for a Commonwealth fishery, the GABTS of the SESSF. The ERA reports are being released in combination with ecological risk management reports, which identify fishery-specific priority issues for managing the ecological effects of fishing, and how each species or group of species may be managed.
The effective implementation of bycatch legislation and policy has been a challenge in the past and significant opportunities for improvements remain. Identifying environmental management priorities and gaining support for necessary action in the context of other management imperatives will remain a key challenge for managers and policy makers alike in the future. The move to an ecosystem-based approach to fisheries management followed the release and adoption of the 1992 National Strategy for Ecologically Sustainable Development by all levels of Australian Government. It is envisaged that annual assessments of the status of the environmental performance of fisheries will help stakeholders identify where significant progress is being made over time and where improvements may still be needed.
Further Reading
| - | You can view the full report by clicking here. |

