The gross value of Australian fisheries production is estimated to have declined by 4.3 per cent in 2009–10 to $2.1 billion (table 3). Large falls in the value of tuna production (34 per cent), rock lobster production (9 per cent) and abalone (5 per cent) were offset by rises in the production value of salmonids (3 per cent) and prawns (10 per cent). Australia’s fishery production remained focused on producing high-value products of rock lobster, salmon, prawns, tuna, and abalone. Together, these species were valued at $1.4 billion in 2009–10, accounting for 64 per cent of total Australian fisheries production.
In recent years, the volume and value of production in Australian fisheries have been affected by unfavourable movements for a number of variables. Fishing effort and catches have been influenced by fuel price increases, and by the appreciating Australian dollar, which makes Australian exports less competitive and overseas imports more attractive to consumers. Reflecting these changes, the gross value of production (GVP) of Australia’s fisheries production has declined by 21 per cent, in real terms, from AU$2.9 billion in 1998–99 to AU$2.3 billion in 2008–09 (figure 4). Most of the decline is attributable to the decline of the wild catch sector GVP, which fell by 35 per cent over the decade, from AU$2.2 billion in 1998–99 to AU$1.4 billion in 2008–09, in real terms (ABARE–BRS 2010). The main drivers of this decline are reductions in prices of key wild caught species such as rock lobster, prawns, abalone and wild caught tuna (figures e and f). Together, these species contribute at least half of Australia’s GVP of fisheries production. The real value of production of these species has dropped by 53 per cent since 1998–99.
Figure 4: Gross value of production of Australian fishery production, 1992 - 93 to 2008 - 09
Figure 5: Average prices of key Australian species
Figure 6: Gross value of production of key species, 1998 - 99 to 2008 - 09
In 2009–10, Australia’s fishery production is estimated to have fallen by 1 per cent to 240,000 tonnes. This was driven by falls in production volumes of rock lobster (17 per cent), tuna (17 per cent) and abalone (15 per cent). The strong declines in production of these species were moderated by increased production of farmed salmonids, which are estimated to have increased by 7 per cent. Prawns, oyster and other mollusc production is also estimated to have increased in 2009–10, by an average of 6.7 per cent (ABARES 2011).
After reaching a peak of 279 000 tonnes in 2004–05, Australian fisheries production has steadily declined. Most of the decline in production since 2004–05 has been shared across a wide range of species, including most fish, crustacean and mollusc species. Lower production volumes of fish—excluding salmon and tuna—drove most of this decline, falling by 23 per cent over the period to 2008–09. Salmon and tuna production contribute 18 per cent of Australian fisheries production, and have increased their production by 76 and 21 per cent, respectively, since 2004–05. Other key species that have increased their production volume since 2004–05 are prawns (2 per cent) and oysters (20 per cent).
The composition of fisheries production has also changed since 2004–05. The volume of aquaculture production has continued to rise as a result of expansion of Australia’s salmonid and tuna growing industry, reaching a total of 70 000 tonnes in 2008–09. In contrast, over the past several years there has been a declining trend in wild catch production, from 236 300 tonnes in 2004–05 to 171 000 tonnes in 2008–09. As a result, aquaculture’s share of production has grown from 17 per cent in 2004–05 to just under 29 per cent in 2008–09.
The growth of the aquaculture sector in Australia has been driven by a strong increase in the production of salmonids. Over the decade to 2008–09, salmonid production almost tripled in volume terms, to 30 000 tonnes, and almost quadrupled in value, reaching $326 million in 2008–09. This accounted for 37 per cent of the total value of Australian aquaculture production. The second most valuable aquaculture species is southern bluefin tuna. In 2008–09, this sector produced 8800 tonnes of tuna for a value of $158 million.
Australia is a net importer of fisheries products in both volume and value terms. However, the composition of fishery product exports is different to imports. Australia mostly exports high–value products, while importing lower valued products (figure 7).
Figure 7: Australian main export and import products (value share in 2009 - 10)
During the past 10 years there has been a significant decline in the export value of Australian fisheries products. This resulted in Australia becoming a net importer in value terms in 2007–08 (figure 8). After peaking in 2000–01, the real value of Australian exports has declined by 55 per cent to $1247 million in 2009–10, driven by large declines in the volume and unit prices of major edible export species, particularly prawns, tuna and abalone (table 2, figure 9). Falls in unit prices since 2000–01 reflect the strong appreciation of the Australian dollar against the Japanese yen and US dollar.
Figure 8: Export and Import values of fish products
Table 2: Volume and value of Australian fisheries products exports.
Figure 9: Export prices for key species 1992 - 93 to 2009 - 10
In contrast to the lower prices for tuna, prawns, abalone and scallops over the period 2000–01 to 2009–10, rock lobster prices have been increasing since 2003–04, owing to reduced supply and continued strong demand from Asian markets. Higher prices for rock lobster have provided some support to the value of Australian fisheries product exports. Lower supply of rock lobster in recent years is a result of management responses to concerns about stock abundance in the Western Australian Rock Lobster Fishery.
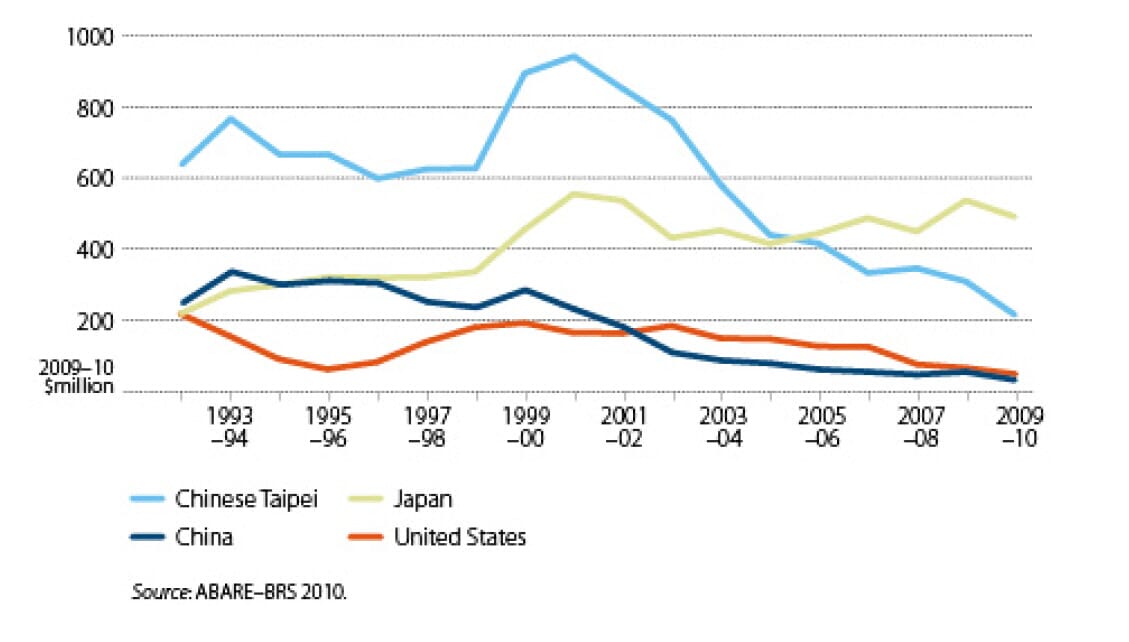
In 2009–10, the main Australian fisheries export destinations in terms of export value were Hong Kong, Japan, the United States and Chinese Taipei (figure 10). These countries accounted for 86 per cent of total Australian seafood exports in 2009–10.
Over the past 10 years, the value of fishery products exported to Hong Kong and China has almost doubled, showing the emergence of these countries as strong export markets. In 2009–10, approximately 40 per cent of fishery products were exported to Hong Kong and China. The growth in Hong Kong’s and China’s share of exports is largely due to their consumption of rock lobster and abalone. These species account for 61 per cent and 26 per cent, respectively, of the total fisheries export value to Hong Kong and China. The species also account for almost 70 per cent of the total Australian export value.
Figure 10: Major export destination markets for fisheries products, 1992 - 93 to 2006 - 10
In 2009–10, the volume of Australian imports of edible fisheries products continued to grow, by 7 per cent to 207 000 tonnes. However, the appreciation of the Australian dollar has meant that the value of these imports has fallen, by 3 per cent to $1.2 billion. The main edible fisheries products imported are canned products ($446 million), contributing 36 per cent of the value of edible fisheries products. Fresh, chilled or frozen prawns also contribute significantly (13 per cent) to the total value of edible fishery product imports, and were valued at $159 million in 2009–10.
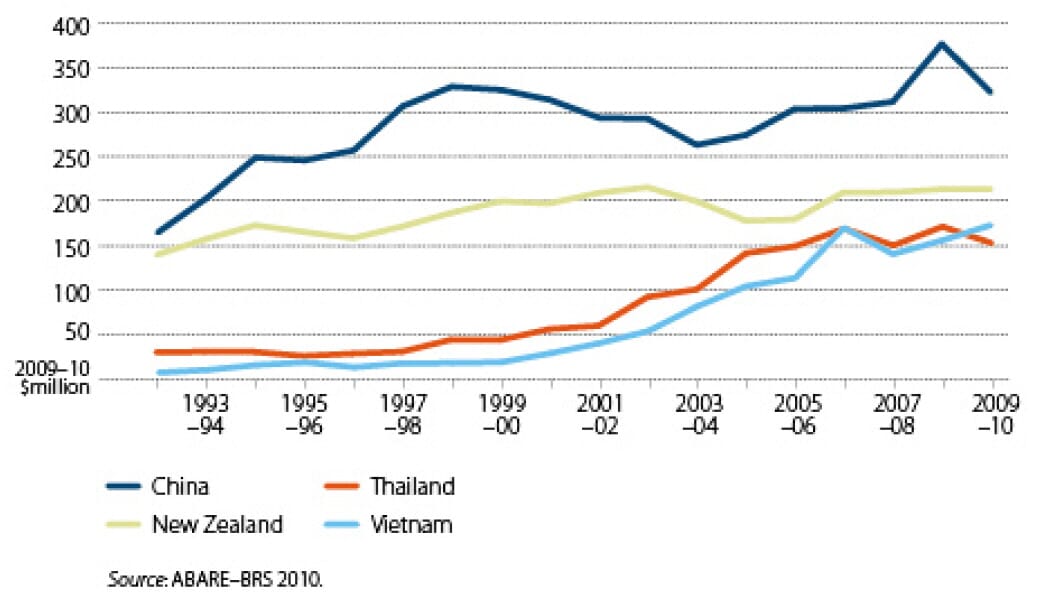
The major sources of Australian fish and fisheries products imports are Thailand, New Zealand, Vietnam and China. Together, these countries accounted for 70 per cent of the total fishery product imports in 2009–10. Although they are still smaller sources of imports than both Thailand and New Zealand (in terms of value), the past decade has seen the emergence of China and Vietnam as sources of fisheries products imports (figure 11).
Figure 11: Major import sources for edible fisheries product (excluding live) in value terms