Trout Value of Sales Increased 8 Percent from 2005
The total value of fish sales received by trout growers in the 20 selected States totaled 74.9 million dollars for 2006, an increase of 8 percent from 2005. Idaho accounted for 55 percent of the total value of fish sold.The number of trout 12 inches and longer sold during 2006 totaled 49.2 million fish, down 11 percent from the previous year. The average price per pound was $1.10, up 5 cents from 2005. The value of sales for the 2006 marketing year was 67.7 million dollars, up 8 percent from 2005. Based on the dollar value, 71 percent were sold to processors and 17 percent were sold to fee and recreational fishing establishments.
The number of 6"- 12" trout sold during 2006 totaled 5.52 million fish, an increase of 15 percent from 2005. The average price per pound was $2.59 during 2006, down 24 cents from the 2005 price. The total value of sales was 5.65 million dollars during 2006, a 9 percent increase from the previous year. The major sales outlet for 6"-12" trout was to fee and recreational fishing establishments accounting for 50 percent of total sales, followed by other producers with 15 percent.
The number of 1"- 6" trout sold during 2006 totaled 7.96 million, a 13 percent increase from the previous year. The average value per 1,000 fish was $183.00 during 2006, a $4.00 decrease from 2005. The total value of sales was 1.46 million dollars, up 11 percent from last year's total.
Distributed Trout
Trout distributed for restoration, conservation, and recreational purposes, primarily by State and Federal hatcheries, included 6.25 million 12" or longer fish, 57.9 million 6"-12" fish, and 83.2 million fingerlings. The estimated value of fish and eggs distributed totaled 81.1 million dollars, up 6 percent from 2005.Trout Losses
Total losses of all trout intended for sale were 30.9 million fish during 2006. The top three categories were 90 percent lost to disease, 4 percent lost to predators, and 2 percent lost to “other” causes.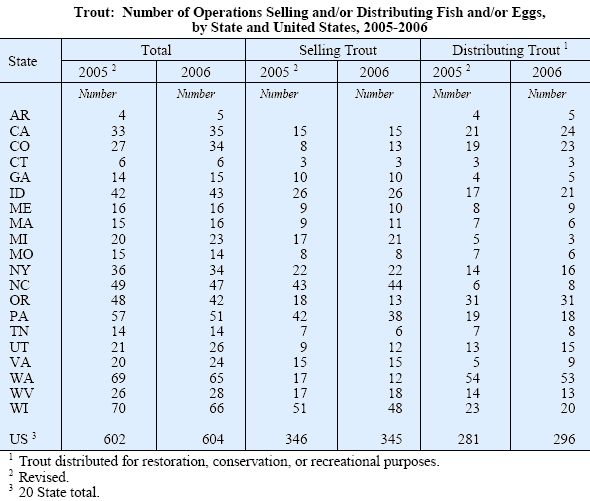
Further Information
To view the full report, including all the numerous tables, please click here (PDF Format)
February 2007

