Regional contribution to global production and implications for the aquafeed supply
Approximately 220 species of aquatic animals and plants are currently cultured worldwide, in a vast range of production systems, ranging from low-input extensive systems to high-input intensive aquafarms in ponds, caged enclosures and tanks. In broad terms, aquaculture production systems used for producing these aquatic animals and plants can be divided into feed-dependent systems or fed aquaculture (e.g. finfish and crustaceans) or non-fed aquaculture systems where culture is predominately dependent on the natural environment for food, e.g. aquatic plants and molluscs.
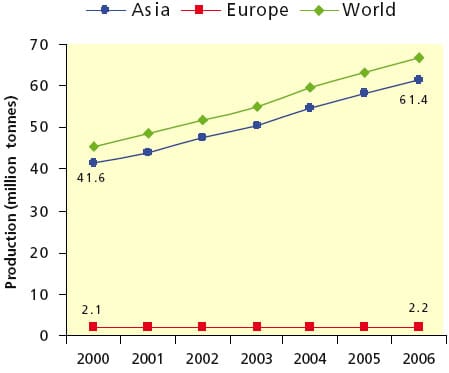
In 2006, global aquaculture production reached 66.7 million tonnes, growing at an annual rate of 9 per cent, while increasing its proportional contribution to total fisheries output. Excluding aquatic plants, aquaculture output in 1970 accounted for 3.9 per cent of total fisheries production, by 2001 that proportion had increased to 29 per cent and by 2006 to 36 per cent (FAO, 2008a). Thus, aquaculture continues to make a significant contribution to total fisheries production over the last few decades. This increasing contribution, however, is largely an Asian phenomenon because Asia accounted for 61.43 million tonnes or 92 per cent of total world aquaculture production in 2006, while Europe contributed 2.17 million tonnes or 2.2 per cent (Figure 1). In terms of value, the Asian region’s share was US$68.61 million or 80 per cent of total value of world aquaculture production. The Asian contribution is significantly influenced and skewed by China. When China is excluded, the Asian contribution to total world aquaculture production drops dramatically to 24.2 per cent in terms of quantity and 29 per cent in terms of value.
Figure 1: Recent trends in aquaculture production
(including aquatic plants)
As is evident, currently, aquaculture production is overwhelmingly concentrated in one country, China. Considering the geographic spread and potential economic contribution of aquaculture in relation to aquafeeds, a better assessment may be made by excluding Chinese fish and aquatic plants to understand the progress made by the other 105 countries that have reported aquaculture production of over 1 000 tonnes in 2006.
When aquatic plants are excluded from production estimates for the Asian region and Asia excluding China, aquaculture production contributes 90 per cent and 23.2 per cent, respectively, in terms of quantity and 78 per cent and 29.2 per cent in terms of value, respectively, to the world total aquaculture production. Aquatic plant production is dominated by China. Seventy-three per cent of total aquatic plant production in Asia is in China. There is no noticeable change in terms of quantity or value of aquaculture in Europe when plants are excluded. In Asia, fed aquaculture accounted for 54 per cent of the region’s total aquaculture production, indicating that almost half of Asia’s aquaculture production comes from non-fed aquaculture. However, the non-fed aquaculture production within Asia is not evenly distributed and is mainly centred in China.
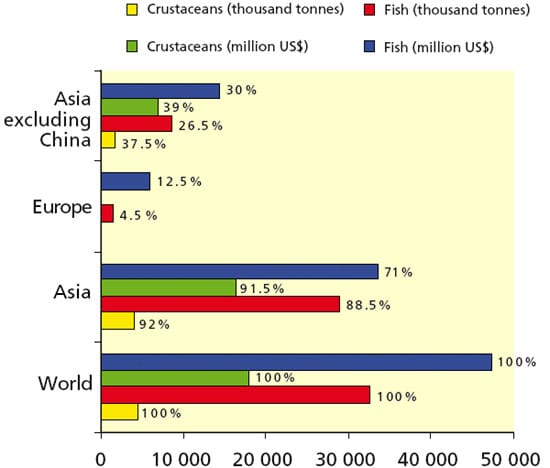
Fifty per cent of China’s total aquaculture production (including plants) is non-fed aquaculture production. Asia’s fed aquaculture, excluding China and including aquatic plants, amounts to 64.2 per cent. If the recent trend in the slowing down of the annual growth of the non- fed aquaculture sector continues (see section below), while maintaining an increase in total aquaculture production, the demand for aquafeed in Asia will significantly increase. In contrast to the Asian situation, finfish and crustacean aquaculture production in Europe is 100 per cent dependent on aquafeeds. Asia’s aquaculture production is also dominated by the use of aquafeeds. Asia is the largest global consumer of aquafeed ingredients. Aquaculture production, mainly of crustaceans and finfish, relies on farm-made or complete industrial diets. It is estimated that Asia contributed 88.5 per cent of fish in terms of quantity and 71 per cent in terms of value to total world fed aquaculture production (Figure 2). In contrast, Europe contributed 4.5 per cent of fish in terms of quantity to total world fed aquaculture production. More importantly, Asia, excluding China, contributed 26.5 per cent of fish in terms of quantity and 30 per cent in terms of value to total world fed aquaculture production, indicating that the demand for aquafeed ingredients is also heavily skewed towards China.
In terms of crustacean fed aquaculture production, Asia contributed 91.5 per cent of total world production (Figure 2). When China is excluded from the Asian equation, the contribution of the rest of Asia is 37.5 per cent of total world crustacean production. Europe’s contribution to world farmed crustacean production is negligible. Therefore, the impact of commodity volatility will be felt to a greater degree in Asia than in Europe.
Figure 2: Contribution of Asia and Europe to world fed aquaculture by type of cultures
Future pressure on the demand for feed ingredients will depend on the changing proportions of fed and non-fed aquaculture to total aquaculture production, the demand and the types of species used to meet the demand of aquatic products. The demand for feed ingredients will also depend on whether the trend will be to increase mass production of low-value species using aquafeeds or to increase production in high-value species, which generally requires high quality performance diets. Either way, the demand for all aquafeed ingredients will increase. Production of high-value species will put upward pressure on fishmeal and fish oil demand and prices, while production of low-value species will increase the demand and price for feed ingredients such as grains and oils of plant origin.
Aquaculture growth in Asia and Europe
All aquaculture species groups have shown positive growth, but the acceleration in growth has varied between species groups. Crustacean production grew at an average annual rate of 24.5 per cent, while that of finfish and molluscs grew at an average growth of 7.0 per cent and 5.0 per cent, respectively, over the period 2000–2006. However, in the last three reporting years, the annual growth of crustacean aquaculture production has declined and stabilized at 9–12 per cent. All other species groups, namely, amphibian, other invertebrates and aquatic plants showed a slowing down in their per centage annual production growth during the same period (Table 1). Thus, crustaceans and finfish are the groups that showed promising growth. As these species groups represent fed aquaculture, this will put greater upward pressure for farm-made or complete commercial diets.
The growth of fed aquaculture production in the Asian region has continued to be strong especially for the marine sector, reflecting a trend over the last ten years. This growth results mainly from a continuous increase in production in China. Between 2000 and 2006, production of fed aquaculture in China increased by 6.8 million tonnes (7.1 per cent annual average growth). In terms of tonnage, other Asian countries that showed large increases included Myanmar, Viet Nam, Thailand, Indonesia, India and the Philippines over the same period (Table 2). Both freshwater and marine fed aquaculture (including brackish water) production showed a steady growth in leading aquaculture producing countries in Asia except in Japan. Out of the ten leading aquaculture producing countries, which contributed 87.1 per cent to regional total fed aquaculture in Asia in 2006, Myanmar (185 per cent), Viet Nam (68.4 per cent), China (29 per cent), and Taiwan Province of China (8 per cent) showed a significantly higher average per centage annual growths in terms of quantity in the marine sector (including brackishwater) than in the freshwater sector over the same period (Table 2). Overall, Myanmar and Viet Nam are emerging as countries with substantial aquaculture growth in both environments (Table 2).
Just as China is the centre of production in Asia, Norway is the centre of fed aquaculture production in Europe, with an average annual per centage growth of 7.3 per cent from 2000 to 2006 (Table 3). In 2006, Norway contributed 48 per cent of total fed aquaculture production in Europe. The other countries in Europe that showed a sizeable contribution to total fed aquaculture tonnage in 2006 were the United Kingdom (10 per cent), the Russian Federation (7 per cent), Greece (6 per cent) and Spain (4 per cent).
| Table 1: Global aquaculture production – per centage growth rates of different species groups | |||||||||
|---|---|---|---|---|---|---|---|---|---|
| Species Groups | 2000 - 2006 | 2000 - 2001 | 2001 - 2002 | 2002 - 2003 | 2003 - 2004 | 2004 - 2005 | 2005 - 2006 | ||
| Amphibians | 33 | 22 | 2 | 92 | 6 | 12 | 4 | ||
| Crustaceans | 24 | 17 | 12 | 36 | 12 | 9 | 12 | ||
| Other invertebrates | 48 | 17 | -27 | 188 | 37 | 21 | -4 | ||
| Molluscs | 5 | 6 | 6 | 4 | 4 | 3 | 5 | ||
| Finfish | 7 | 7 | 6 | 3 | 8 | 6 | 7 | ||
| Aquatic plants | 8 | 4 | 9 | 8 | 11 | 6 | 2 | ||
| Source: FAO (2008a). | |||||||||
| Table 2: Global aquaculture production – per centage growth rates of different species groups | |||||||||
|---|---|---|---|---|---|---|---|---|---|
| Country | 2000 Production (thousand tonnes) | 2006 Production (thousand tonnes) | Average Annual Growth (%) | ||||||
| Total | Freshwater | Marine | Total | Freshwater | Marine | Total | Freshwater | Marine | |
| China | 15881 | 15077 | 804 | 22650 | 20445 | 2205 | 7.1 | 6.0 | 29.0 |
| India | 1 941 | 1 844 | 97 | 3123 | 2973 | 150 | 10.2 | 10.2 | 9.2 |
| Viet Nam | 459 | 365 | 94 | 1512 | 1034 | 478 | 38.3 | 30.6 | 68.4 |
| Indonesia | 789 | 363 | 426 | 1293 | 664 | 629 | 10.7 | 13.8 | 8.0 |
| Thailand | 589 | 270 | 319 | 1021 | 502 | 519 | 12.2 | 14.4 | 10.4 |
| Bangladesh | 657 | 570 | 87 | 892 | 785 | 107 | 6.0 | 6.0 | 4.0 |
| Philippines | 363 | 112 | 251 | 587 | 245 | 342 | 10.0 | 20.0 | 6.1 |
| Myanmar | 99 | 94 | 5 | 575 | 515 | 60 | 80.0 | 75.0 | 185.0 |
| Japan | 321 | 60 | 261 | 302 | 42 | 260 | -1.0 | -5.2 | 0.0 |
| Taiwan Province of China | 179 | 131 | 48 | 217 | 145 | 72 | 3.5 | 1.7 | 8.4 |
| Source: FAO (2008a). | |||||||||
| Table 3: Production of fed aquaculture in the top ten producing countries in Europe | |||||||||
|---|---|---|---|---|---|---|---|---|---|
| Country | 2000 Production (thousand tonnes) | 2006 Production (thousand tonnes) | Average Annual Growth (%) | ||||||
| Total | Freshwater | Marine | Total | Freshwater | Marine | Total | Freshwater | Marine | |
| Norway | 490 | - | 490 | 705 | - | 705 | 7.3 | - | 7.3 |
| United Kingdom | 140 | 10 | 130 | 146 | 11 | 135 | 0.7 | 1.6 | 0.6 |
| Russian Federation | 74 | 74 | - | 105 | 105 | - | 7.1 | 7.1 | - |
| Greece | 71 | 3 | 68 | 85 | 4 | 81 | 3.3 | 5.5 | 3.2 |
| Spain | 49 | 34 | 15 | 59 | 26 | 33 | 3.5 | -4.0 | 20.0 |
| France | 60 | 54 | 6 | 51 | 42 | 9 | -2.5 | -3.7 | 8.3 |
| Italy | 67 | 49 | 18 | 49 | 33 | 16 | -4.4 | -5.4 | -1.8 |
| Denmark | 44 | 36 | 7 | 37 | 28 | 9 | -2.6 | -3.7 | 4.8 |
| Poland | 36 | 36 | - | 36 | 36 | - | 0.0 | 0.0 | - |
| Germany | 42 | 42 | - | 32 | 32 | - | -3.2 | -3.2 | - |
| Source: FAO (2008a). | |||||||||
Marine aquaculture of high-value species fed complete commercial diets is a predominant feature of European fed aquaculture. While registering a negative growth in freshwater sector, positive aquaculture growth rates in the marine sector during 2000–2006 were shown in Denmark, France and Spain (Table 3). Over the same period, Germany also registered negative growth in the freshwater sector (Table 3). The overall trend in fed aquaculture in both the Asian and European regions is to focus on marine aquaculture (including brackishwater) of usually high-value species that require complete commercial or high performance diets.
Further Reading
| - | You can view the full report by clicking here. |
