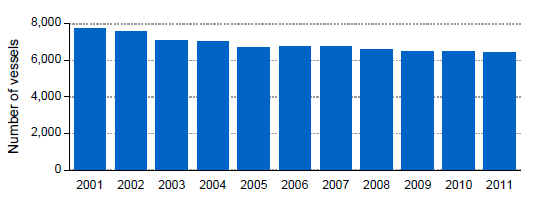
Fleet Size and Employment
In 2011, the UK fishing industry had 6,444 fishing vessels compared with 7,721 in 2001, a reduction of 17 per cent. The fleet in 2011 comprised 5,056 10 metre and under vessels and 1,388 over 10 metre vessels.
UK Fleet Size: 2001 to 2011
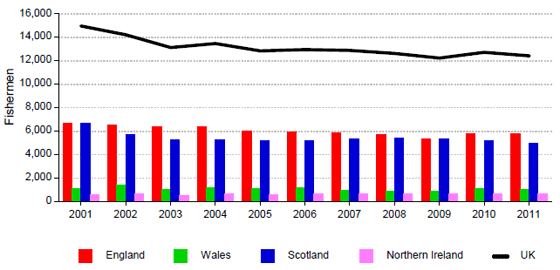
There were around 12,400 fishermen in 2011, down 17 per cent since 2001. Of these, 5,800 were based in England (down 13 per cent since 2001), 1,000 in Wales (down 11 per cent), 5,000 in Scotland (down 25 per cent) and 700 in Northern Ireland (up 23 per cent). Part-time fishermen accounted for 19 per cent of the total, a proportion that has changed little over the last ten years. Further details can be found in Chapter 2.
Number of Fishermen in the UK: 2001 to 2011
Catch by UK Vessels
Chapter 3 presents information on quantity (live weight), value and area of capture for all UK vessels landing into the UK and abroad as well as for foreign vessels landing into the UK. Landings by member states against individual European Commission quotas for each fish stock targeted by the UK are also provided.
UK Vessels Landing into the UK and Abroad: 2001 to 2011
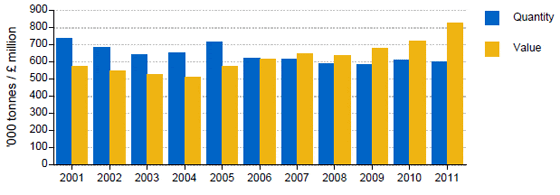
In 2011, UK vessels landed 600 thousand tonnes of sea fish (including shellfish) into the UK and abroad with a value of 828 million. This represents a 1 per cent fall in quantity but a 15 per cent increase in value compared with 2010. The rise in value is primarily due to an increase of more than 40 per cent in the average price of pelagic fish.
UK Vessels Landing into the UK and Abroad by Species Group: 2001 to 2011
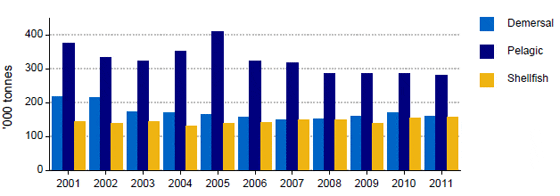
The quantity of landings of demersal fish decreased by 5 per cent between 2010 and 2011 and the quantity has fallen by 27 per cent since 2001. Pelagic landings decreased by 1 per cent between 2010 and 2011 and shellfish landings rose by 3 per cent over the same period.
Value of Landings by UK Vessels
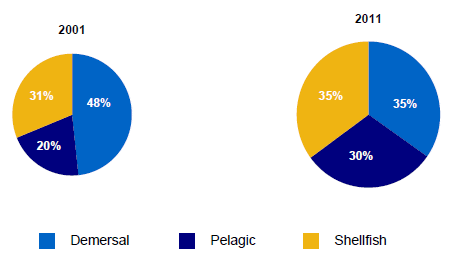
In 2001, demersal fish accounted for almost half of total landings by value. By 2011, this had fallen to 35 per cent, with pelagic and shellfish comprising 30 per cent and 35 per cent respectively.
Landings into the UK and Abroad by Vessel Nationality: 2001 to 2011
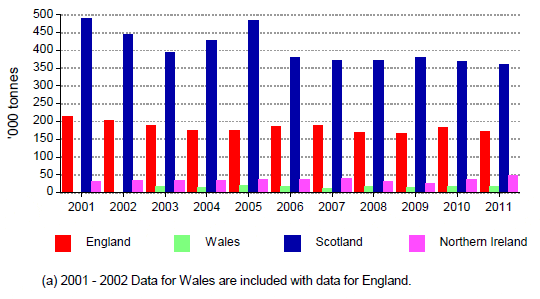
Landings by Scottish vessels fell from 488 thousand tonnes in 2001 to 359 thousand tonnes in 2011. Over that period, the Scottish fleets share of total landings fell from 66 per cent to 60 per cent. The English fleets share was 28 per cent in 2011.
Landings into the UK and Abroad by Vessel Nationality and Species Group: 2011 (000 tonnes)
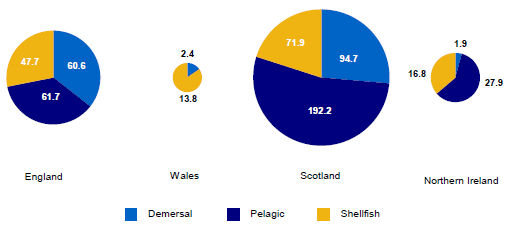
In terms of quantity, over half the Scottish and Northern Irish fleets landings was pelagic fish. The Welsh fleet landed mainly shellfish while the largest component of landings by the English fleet was pelagic fish, very closely followed by demersal fish.
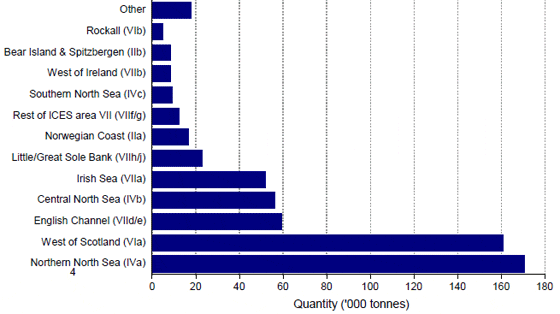
Catch by Sea Area
In 2011, 55 per cent of all landings by UK vessels were caught from Northern North Sea or West of Scotland (ICES divisions IVa and VIa see Appendix 2 for a map of fishing areas).
Catch by Sea Area, UK Vessels: 2011
Catch by Individual Species
Landings of Key Demersal Species into the UK and Abroad by UK Vessels: 1995 to 2011
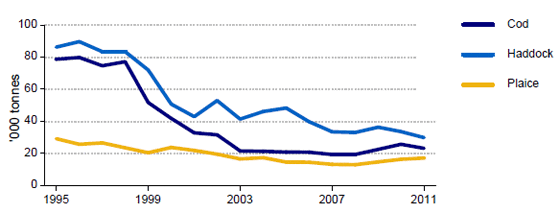
Falling catches of cod and haddock have contributed to the large reduction in demersal landings since 1995. In 2011, the UK fleet landed 23 thousand tonnes of cod (down 71 per cent since 1995) and 30 thousand tonnes of haddock (down 65 per cent since 1995). This represents a combined decrease of 112 thousand tonnes.
Landings of Key Pelagic Species into the UK and Abroad by UK Vessels: 1995 to 2011
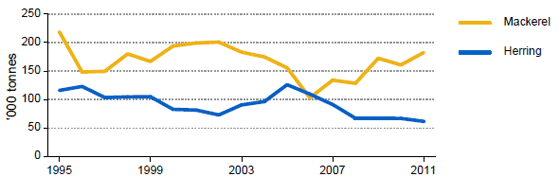
In 2011, 182 thousand tonnes of mackerel were landed, an increase of 77 per cent since the low point of 2006. Since 1995 herring landings have fallen by 47 per cent to 62 thousand tonnes.
Landings of Key Shellfish Species into the UK and Abroad by UK Vessels: 1995 to 2011
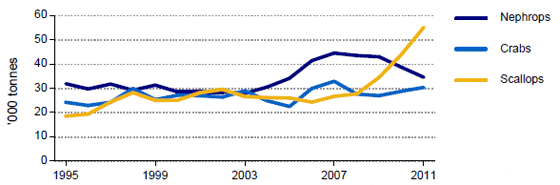
In 2011, 35 thousand tonnes of nephrops were landed, an 8 per cent increase since 1995. Landings of crabs have increased by 25 per cent since 1995 to 30 thousand tonnes. The quantity of scallops landed was 55 thousand tonnes, up 37 thousand tonnes since 1995.
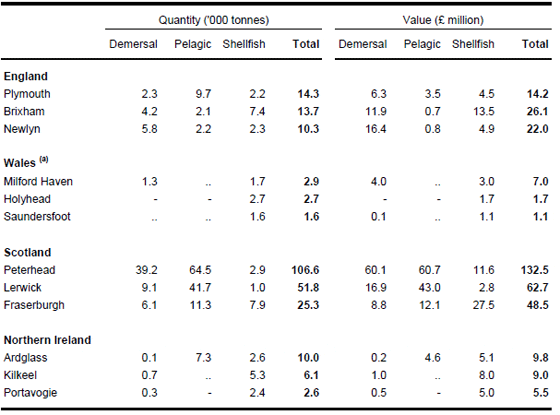
Landings into UK Ports
Table 1.1 shows landings figures for three key ports in each UK country. In 2011, Peterhead, Lerwick and Fraserburgh accounted for 45 per cent by quantity and 39 per cent by value of all landings by UK vessels into the UK.
Landings by UK Vessels into Key Ports: 2011
Source: Fisheries Administrations in the UK
(a) In 2011, Bangor was the Welsh port with the largest quantity of landings (5.4 thousand tonnes);
however, this was of relatively low value mussel seed.
Average Value
Average Live Weight Value: 2011
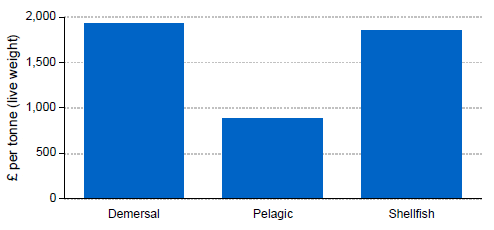
In 2011, the average value of shellfish landed by UK vessels into the UK was 1,850 per tonne (live weight) compared with 1,932 per tonne for demersal species and 885 per tonne for pelagic species. Figures for key species are shown below.
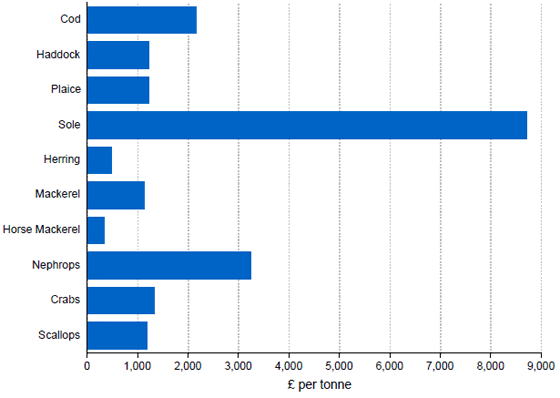
Average Live Weight Value of Key Species: 2011
Catch by Sector
In 2011, 99 per cent of the pelagic fish and 95 per cent of the demersal fish landed by the UK fleet
were caught by vessels in a producer organisation. In contrast, just over half of all shellfish were
landed by vessels in the non-sector and the 10 metres and under pool.
Chapter 2 shows the membership of fish producer organisations for vessels over 10 metres in
length. An overview of the landings by each producer organisation, as well as for the non-sector
and the 10 metres and under pool, is given in Chapter 3.
Fishing Effort
An overview of fishing effort in recovery areas is given in Chapter 2. In 2011:
- Fishing effort with regulated whitefish trawls has fallen by 47 per cent since the implementation of the Cod Recovery Zone in 2003.
- Activity in the Sole Recovery Zone with regulated beam trawls has fallen by 27 per cent since its creation in 2004.
- Effort on fishing trips targeting scallops in ICES sub-area VII has increased by 47 per cent since 2001, while effort on similar trips in ICES sub-areas V and VI decreased by 55 per cent.
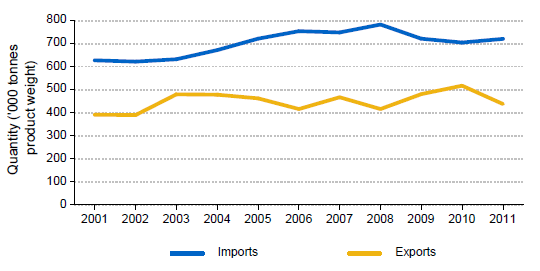
Imports and Exports
In 2011, imports of fish and fish preparations rose to 720 thousand tonnes, a 2 per cent increase from 2010. Over the same period, exports decreased by 15 per cent to 437 thousand tonnes.
UK Imports and Exports: 2001 to 2011
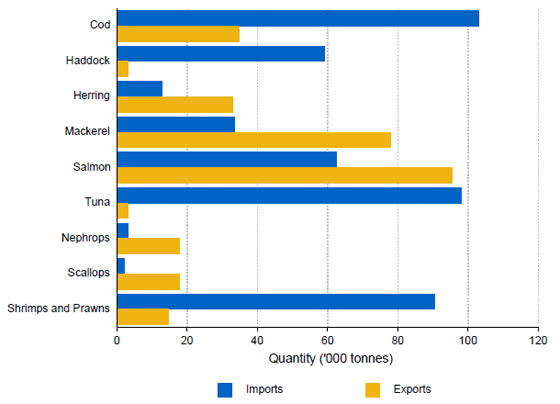
In 2011, imports were highest for cod, tuna, shrimps and prawns and salmon. The UKs main exports were salmon, mackerel and cod.
UK Imports and Exports by Key Species: 2011
In 2011, imports into the UK were highest from Iceland (70 thousand tonnes), China (68 thousand
tonnes) and Thailand (53 thousand tonnes). Of the UK exports, the largest amounts went to
France (79 thousand tonnes), the Netherlands (73 thousand tonnes) and the United States of
America (43 thousand tonnes). Full details on imports and exports are in Chapter 4.
Chapter 5 provides summary information on the scientific assessment of key fish stocks. Chapter 6
compares the UK fishing industry with other European countries and the rest of the world.
November 2012


