Imports by commodity
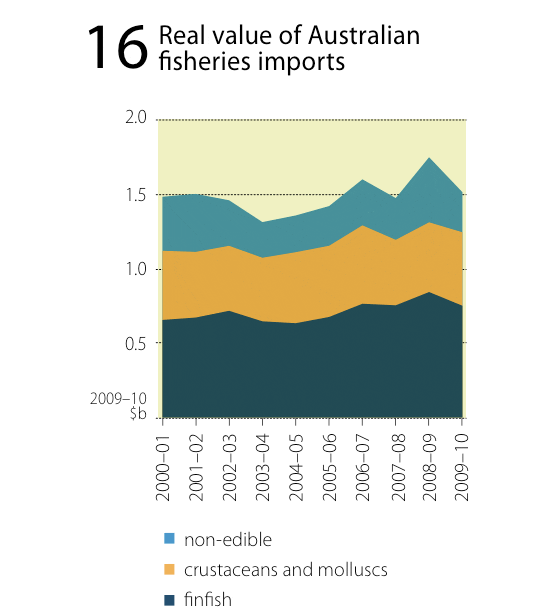
Approximately 82 per cent of this value consisted of edible products (valued at A$1.2 billion). Edible imported products in 2009–10 included A$751.5 million of finfish (60 per cent of total edible imports) and A$494.2 million of crustaceans and molluscs (40 per cent). Non-edible products accounted for the remaining 18 per cent (A$269 million) of imports in value terms and included pearls, fish meal and marine fats and oils (figure 16).
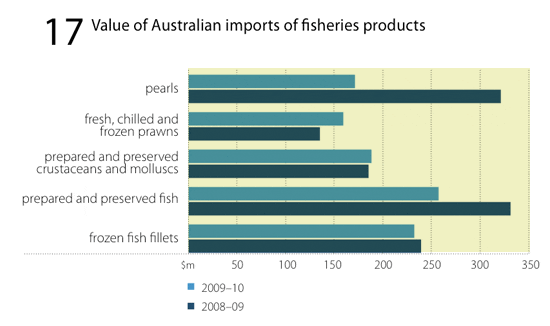
The key cause of the decrease in import value in 2009–10 was a 37 per cent (A$158.1 million) decrease in the value of non-edible fisheries products. A decline in the value of finfish imports, which fell by nine per cent (A$73.2 million), was also a key factor. The major imported products in 2009–10 were prepared and preserved fish (A$257.5 million), frozen fish fillets (A$231.8 million), pearls (A$170.8 million) and fresh, chilled or frozen prawns (A$159.2 million) (figure 17).
Edible fisheries products
Key products: fish (prepared and preserved, frozen fillets), prawns (fresh, chilled or frozen)Imports of edible fisheries products in 2009–10 fell by three per cent (A$37 million) in value terms to A$1.2 billion. The largest decrease in edible import value was from imports of prepared and preserved fish, which fell by A$73.7 million (22 per cent), and frozen fish fillets, which fell by seven million dollars (three per cent).
In 2009–10, 60 per cent (A$751.5 million) of the total value of edible fisheries product imports was from finfish, while crustaceans and molluscs comprised the remaining 40 per cent (A$494.2 million).
Finfish imports were valued at A$751.5 million and accounted for 60 per cent of total edible imports in 2009–10. The largest categories of edible finfish imports in value terms were prepared and preserved fish (A$257.5 million) and frozen fish fillets (A$231.8 million).
The value of finfish imports fell by nine per cent (A$73.2 million) in 2009–10 mainly because of the lower import value of prepared and preserved fish and frozen fish fillets. Imports of these product types accounted for a total of 65 per cent of the total value of finfish imports.
Prepared and preserved fish imports fell by 22 per cent, from A$331.2 million in 2008–09 to A$257.5 million in 2009–10. Prepared and preserved tuna and salmon (predominantly canned) contributed A$168.1 million (65 per cent) and A$51.9 million (20 per cent), respectively, to the total value of prepared and preserved fish imports.
The import value of frozen fish fillets fell by three per cent (seven million dollars) to A$231.8 million, because of a decrease in the average unit export price. The value of smoked, dried or salted fish product imports also fell by eight per cent (four million dollars) to A$46 million.
In 2009–10, crustacean and mollusc imports rose by eight per cent (A$36.1 million) to A$494.2 million. This consisted mainly of prawns (A$298.7 million, including prepared and preserved), followed by fresh, chilled or frozen calamari, squid and octopus (A$62 million) and fresh, chilled or frozen scallops (A$33.5 million).
The increase in value was mainly driven by significant increases in the import values of prawn products, which accounted for 60 per cent of the total value of crustacean and mollusc imports. The import value of prawn products (mainly fresh, chilled or frozen prawns, and prepared and preserved prawns) rose by A$28 million (10 per cent) to A$298.7 million in 2009–10.
This was mainly the result of a 29 per cent increase in its import volume. The import value of fresh, chilled or frozen calamari, squid and octopus also increased, but to a lesser extent, by A$7.8 million (14 per cent) to A$62 million. This reflected a 20 per cent increase in the average import price. The import value of fresh, chilled or frozen scallops also rose by A$3.7 million (12 per cent) to A$33.5 million in 2009–10.
Imports by source
Edible fisheries products
Key sources: Thailand, New Zealand, China, VietnamThe major sources for Australian edible imports (excluding live products) in 2009–10 were Thailand, New Zealand, China and Vietnam (figure 18). Thailand remained the largest source by value (A$322.3 million in 2009–10), accounting for 26 per cent of the total import value. New Zealand, China and Vietnam accounted for 17 per cent, 14 per cent and 12 per cent of the total edible import value, respectively.
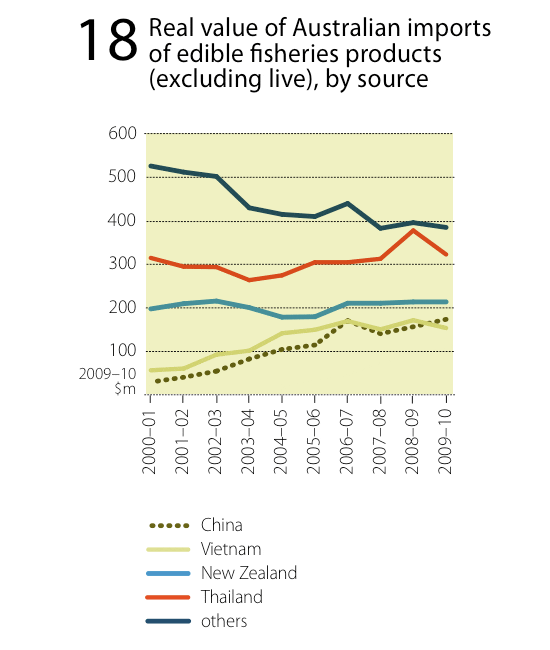
The major import product from Thailand was prepared and preserved fish (primarily tuna), which accounted for about 55 per cent of the total value of edible fisheries products imported from Thailand in 2009–10.
The major import products from New Zealand were frozen fish fillets and fresh and chilled whole fish. In 2009–10, Australia imported A$62 million of frozen fish fillets and A$56.4 million of fresh and chilled whole fish from New Zealand.
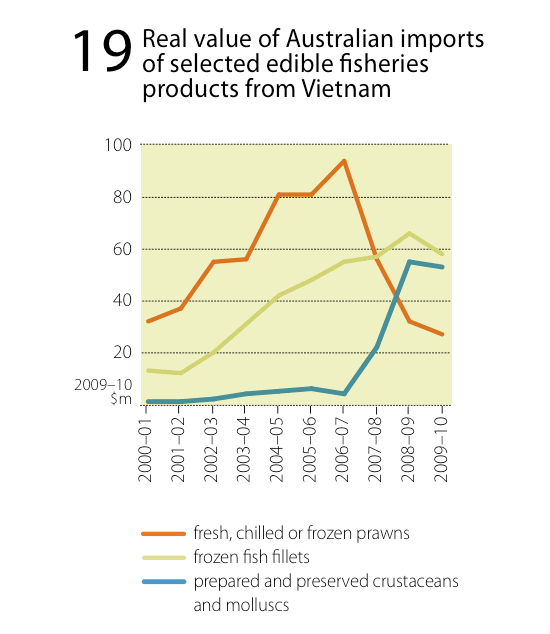
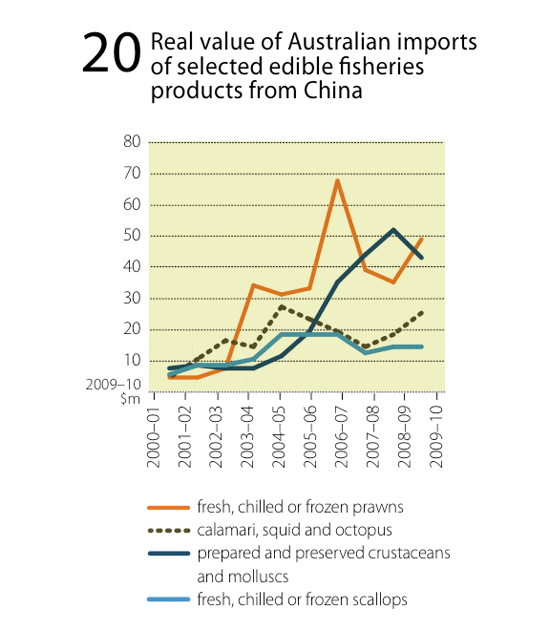
The import value of edible fisheries products from Viet Nam and China has increased in recent years (figures 19 and 20). The total import value from Viet Nam and China increased by A$96.6 million and A$144.1 million, respectively, in real terms from 2000–01 to 2009–10. The main commodity imported from both countries was prawns.
In 2009–10, Australian imports of fresh, chilled or frozen prawn products from China continued to increase, rising by 42 per cent (A$14.6 million) to A$49.1 million. This was a result of a 66 per cent (A$17.2 million) increase in the value of uncooked frozen whole prawns from A$26.2 million in 2008–09 to A$43.4 million in 2009–10.
In contrast, imports of all prawn products from Viet Nam decreased by five per cent (A$4.5 million) to A$79.2 million. This reflected a 14 per cent (A$4.4 million) decrease in the value of uncooked frozen whole prawns imported from Viet Nam between 2008–09 and 2009–10.
Non-edible fisheries products
Key sources: Peru, Norway, NZ, USImports of non-edible fisheries products fell by 37 per cent (A$158.1 million) to A$269 million in 2009–10. Imports classified as being re-imported Australian product were 57 per cent of this value and were the cause of the large decrease in 2009–10. Australian re-imports accounted for A$154.2 million, nearly all of which comprised re-imported pearl products.
In 2009–10, most imports of non-edible fisheries products that are not re-imports were sourced from Peru, Norway and NZ. Combined, these countries accounted for 22 per cent (A$59 million) of the Australian total value of non-edible fisheries products in 2009–10.
The major commodities imported from Peru in 2009–10 were fat and oil products (A$8.5 million) and fish meals (A$33.5 million). The major products imported from Norway were fat and oil products, which contributed A$8.8 million of total non-edible import value from that country in 2009–10. Other major import sources were NZ and Indonesia, amounting to A$7.2 million and A$6.6 million, respectively.
