© Stephen Bures, Shutterstock
In simple terms, a food product’s carbon footprint is expressed as the total kg of CO2 (or relative amounts of other greenhouse gases which are converted to CO2 units, based on a comparable global warming impact) released per kg of finished, edible product. This total value involves all activities over the course of production, processing, distribution and waste disposal/degradation (including food waste). All of these phases taken together are referred to as the product life cycle. Estimates of emission quantities are generated for each input in each phase, and then combined.
Of course, calculating carbon footprint values requires a somewhat subjective approach, with some commodities exhibiting much more variability than others. Reported carbon footprints range from < 0.05 to 0.5 for potatoes and < 0.25 to 1.9 for maize. And to make matters worse, methodology for calculating carbon footprints is far from standardised.
Nonetheless, the more typical or consistent values can be useful in terms of weighing the environmental impacts of various products and approaches to food production. For example, according to the SU-EATABLE_LIFE database of carbon and water footprints, sunflower oil has a carbon footprint of only 0.98 kg while that of olive oil is 3.27 kg. Similarly, the database indicates milk from cows has a value of 1.31 kg, while buffalo milk is estimated at 3.57 kg.
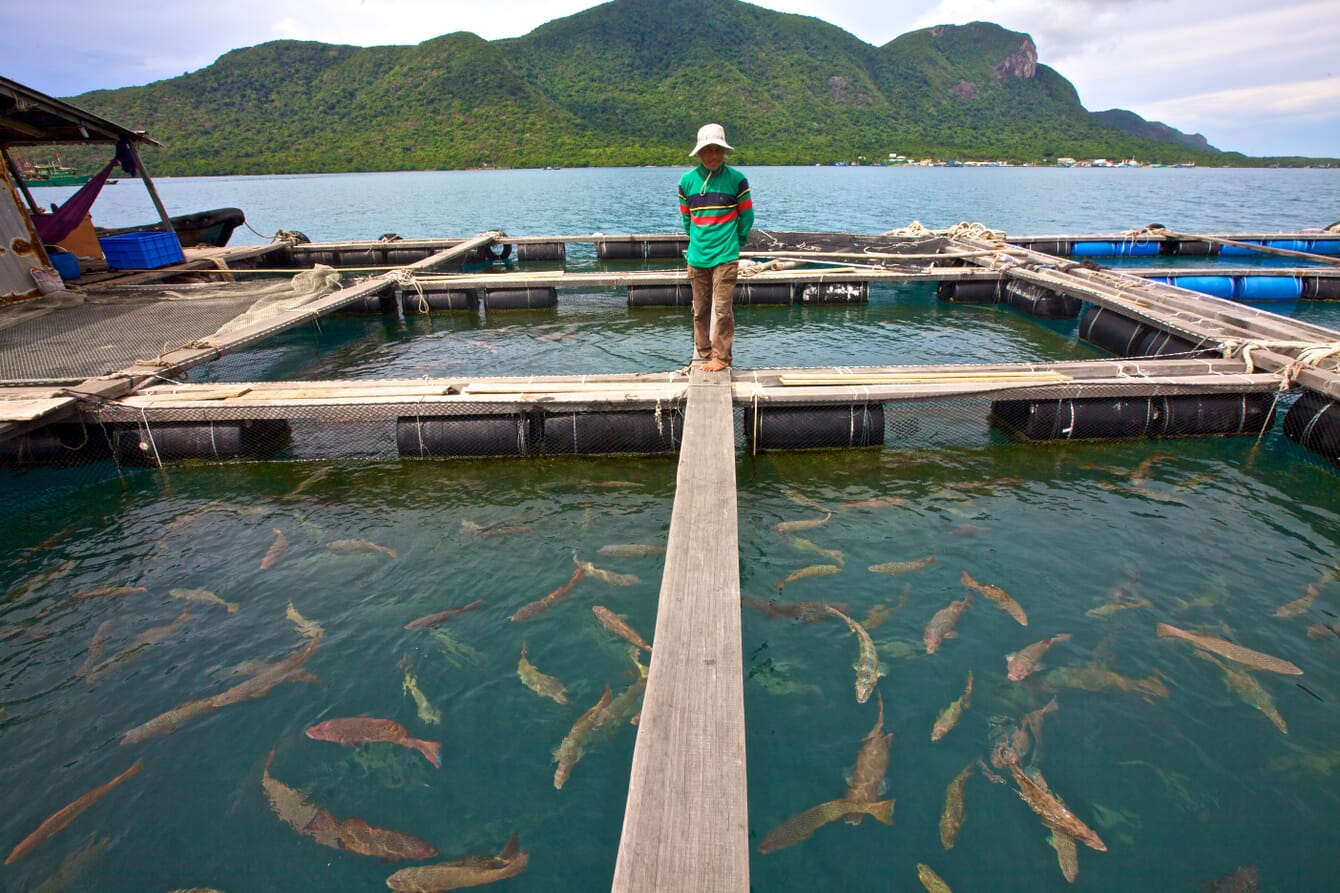
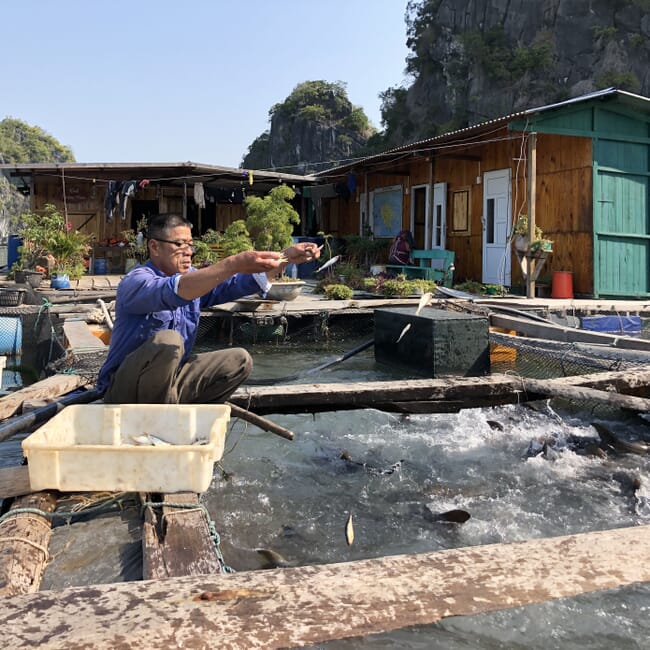
Carbon footprints of various aquaculture species vary greatly
Carbon footprint values ranging from 4 kg to 540 kg have been reported for wild seafood products (per kg protein), compared to a range of 4 to 75 for aquaculture (also per kg protein). High rice methane emissions account for much of the carbon footprints of lower-value fish in Asia, such as Indian major carps and other cyprinids, while global salmonid values are more influenced by emissions associated with fishmeal production and land-use changes for soybean farming.
Many estimates of carbon footprints for farmed finfish range between 4 and 6 (per kg carcass weight at the farm gate), while cultured bivalves have much lower values and farmed shrimp have somewhat higher estimates. A group of researchers in Belgium decided to modify the ecological footprint of wild harvested fish by incorporating the amount of land indirectly required for their growth under natural conditions. Using this method, the “ecological” footprint of aquaculture species was 2 to 15 times lower than for wild species. Variability among estimates for aquaculture species largely reflects differences in myriad life cycle factors. These include feed composition, energy sources (how the required electricity is generated and what types of fuel are used by production operations), transport methods, product forms and distribution. Of course, this implies a similar abundance of potential methods to reduce carbon footprints.
A study published in 2016 reported that land-based RAS farm production of Atlantic salmon in the US generated a carbon footprint of 7.01, compared to only 3.39 for offshore net-pen production in Norway. However, when both products were placed in front of consumers in a North American city , other life cycle factors such as transportation (airfreight) and cold chain requirements resulted in carbon footprints of 7.41 and 15.22, respectively, for the two salmon sources. A separate study found that the total carbon footprint for fresh, gutted salmon produced in Norway and airfreighted to Tokyo was approximately 14.
Similar factors come into play for major commodities such as tilapia, shrimp and trout. Transport costs are significantly lower for frozen product than fresh and in fact, the relative impact of fresh vs frozen on carbon footprints has been debated for some time. Remember, normal or “typical” levels of food waste must be factored in when calculating a full life cycle estimate. While frozen product incurs more greenhouse gas releases due to the energy required for initial freezing and subsequently maintaining sub-zero temperatures (as well as refrigerant leakage and more packaging in most instances), fresh product often results in more spoilage and waste. As carbon footprints play a more important role in policy, economics and consumer preference in the coming years, the importance of producing seafood close to major markets will grow. This may bode well for proponents of RAS, but the technology will need to evolve to further reduce costs.
The SU-EATABLE_LIFE database also provides some interesting carbon footprint estimates for farmed seafood, especially when compared with other commodities. The value listed for farmed prawns/shrimp is 15.07 while that of wild caught prawns/shrimp is 7.04 (remember these values are simply for greenhouse gas emissions, and by-catch, turtle mortality and benthic perturbations are not included in the estimate calculations). In contrast the estimates for wild caught and farmed trout are very similar, at 4.20 kg and 4.38 kg, respectively. Farmed salmon are estimated to generate a mere 1.61 kg while the wild caught salmon estimate is reported as 3.37 kg. For comparison, bone-in and boneless beef are listed at 17.96 kg and 25.75 kg, respectively.
Some counterintuitive realities present themselves when we look at sustainability through the lens of carbon footprints. One might be tempted to assume that low-input, low yield agriculture would generate smaller carbon footprints, but it has been shown in many instances that intensification of crop production generally results in substantially lower carbon footprints. This results from calculating values as kg of CO2 emission per kg of product, and higher yields often tend to spread the inevitable releases across more units of production. Researchers in China reported similar results for rice-fish co-culture. Small farm production units actually generated higher carbon emissions than larger-scaled operations. Moreover, a team of researchers from the Netherlands and Vietnam found that fish from small family-owned pangasius farms generated carbon footprints that were 0.824 kg (roughly 14 percent) higher than those of fish from corporate farms (6.73 vs 5.91, respectively).
Growing importance of carbon footprint values
Consumer visibility is one obvious aspect of the role of carbon footprint estimates in aquaculture. Consumers in a number of countries have become accustomed to seeing carbon footprint labelling. However, the current system for labelling food products is still not standardised, and at times difficult to interpret. Studies in a number of developed countries suggest that consumers accustomed to preferentially purchasing “eco-friendly” products also tend to notice and act on carbon footprint labelling. These consumers typically have higher levels of income and education, but it has been shown that a simplified labelling approach (thumbs up, green lights, and other easy-to-interpret symbolism) can also improve consumer preferences in lesser-developed, middle-income nations.
Environmental realities, rather than marketing ones, are clearly more fundamental when we begin to assess the carbon footprints of various aquaculture commodities. The bulk of global aquaculture production is not destined to end up on the dinner plates of highly educated, comparatively wealthy consumers. Of more universal concern, from a sustainability perspective, are the relative impacts of various forms of aquaculture on those most reliant on it, and on their environment. And how to assess those impacts continues to be an important consideration.
© Eric Isselee, Shutterstock
Public awareness and corporate positioning
Cargill recently announced an initiative to “help aquafarmers raise more sustainable seafood with less environmental impact”. The programme, titled SeaFurther Sustainability, has a goal of reducing CO2 emissions by 30 percent per tonne of food produced. Beginning with salmon farming, Cargill will focus on sourcing more environmentally friendly ingredients, further improving the conversion of feedstuffs into edible product, and improving the efficiency of transportation throughout the supply and value chains. Once in place for salmon producers, Cargill anticipates extending the programme to farmed shrimp production.
Skretting has also introduced a line of aquaculture feeds designed to reduce the carbon footprints of farmed species. These feeds, marketed as Feed4Future diets, are formulated to allow a 10 percent reduction in the on-farm carbon footprint. Additional CO2 emissions associated with the feed line are compensated for by Skretting’s reducing emissions from deforestation and forest degradation project in Brazil. Much of the improved environmental performance can be attributed to careful feed ingredient choices with a focus on sustainability.
In its 2017 Salmon Farming Industry Handbook, Marine Harvest [since rebranded as Mowi] reported on its own carbon footprint findings. The company calculated a carbon footprint of 2.9 for farmed salmon, compared with values of 2.7, 5.9 and 30 for chicken, pork and beef, respectively. Important components of this relative superiority included better protein retention and production of more edible meat per unit of feed. And for perspective, remember that other carbon footprint estimates have placed the value for farmed salmon as low as 1.6 kg.
Future uncertainties
Land use and land-use change (LULUC) equivalents have been cited as a relevant component of the lifecycle of farmed shrimp. Specific concern focuses around the conversion of coastal mangroves to shrimp ponds and the resulting oxidation of carbon and loss of ecosystem services. Some researchers have suggested that CO2 emissions resulting from this practice could be extremely high. This factor, however, is dependent on numerous assumptions and open to a broad range of interpretations. On the other hand, deepening these areas for pond construction tends to reduce methane emissions, one of the easy criticisms of aquaculture, since flooded soils tend to generate methane.
Also, when it comes to converting mangrove forests, there are few comparable examples for most other commodities. One of those might be the inclusion of deliberate deforestation for production of soybeans or palm oil (land-use change), but no effort seems to be made in other commodity estimates to incorporate deforestation that occurred decades or centuries ago. However, if we are keeping score based on carbon footprints, aquaculture seems to be generating results well above those of most animal protein industries.