Trout Value of Sales Increased 9 Percent from 2006
The total value of fish sales received by trout growers in the United States totaled 87.5 million dollars for 2007, an increase of 9 percent from 2006. Idaho accounted for 53 percent of the total value of fish sold.
The number of trout 12 inches and longer sold during 2007 totaled 59.7 million fish, up 14 percent from the previous year. The average price per pound was $1.15, up 4 cents from 2006. The value of sales for the 2007 marketing year was 80.0 million dollars, up 10 percent from 2006. Based on the dollar value, 67 percent were sold to processors and 16 percent were sold to fee and recreational fishing establishments.
The number of 6"- 12" trout sold during 2007 totaled 4.99 million fish, a decrease of 20 percent from 2006. The average price per pound was $2.95 during 2007, up 40 cents from the 2006 price. The total value of sales was 5.84 million dollars during 2007, a 9 percent decrease from the previous year. The major sales outlet for 6"-12" trout was to fee and recreational fishing establishments accounting for 45 percent of total sales, followed by other producers with 16 percent.
The number of 1"- 6" trout sold during 2007 totaled 9.56 million, a 10 percent increase from the previous year. The average value per 1,000 fish was $177 during 2007, unchanged from 2006. The total value of sales was 1.70 million dollars, up 10 percent from last year's total.
Distributed Trout
Trout distributed for restoration, conservation, and recreational purposes, primarily by State and Federal hatcheries, included 8.20 million 12" or longer fish, 68.7 million 6"-12" fish, and 78.9 million fingerlings. The estimated value of fish and eggs distributed totaled 102 million dollars, up 16 percent from 2006.
Trout Losses
Total losses of all trout intended for sale were 34.3 million fish during 2007. The top three categories were 86 percent lost to disease, 8 percent lost to predators, and 4 percent lost to drought.
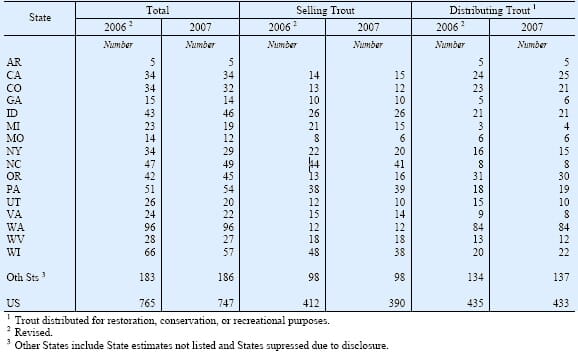
Trout: Number of Operations Selling and/or Distributing Fish and/or Eggs,
by State and United States, 2006-2007
Further Reading
| - | You can view the full report including the tables by clicking here. |
February 2008

