Here, Dalal Al-Abdulrazzak and Daniel Pauly, use Google Earth to count intertidal fishing weirs off the coast of six countries in the Persian Gulf, otherwise known as the Arabian Gulf. Although the name of this body of water remains contentious, we use the name used in Google Earth. Combining, in a Monte Carlo procedure, the number of weirs (after correcting for poor resolution and imagery availability) with assumptions about daily catch and fishing season lengths, we estimate that 1900 (±79) weirs contribute to a regional catch up to six times higher than the officially reported catches of 5260 t. These results, which speak to the unreliability of officially reported fisheries statistics, provide the first example of fisheries catch estimates from space, and point to the potential for remote-sensing approaches to validate catch statistics and fisheries operations in general.
Introduction
Fishery catch statistics are often unreliable (Watson and Pauly, 2001; Clarke et al., 2006; Zeller et al., 2006, 2007). Statistics submitted annually by member countries to the United Nations Food and Agriculture Organization (FAO) frequently neglect or under-report the contribution of small-scale fisheries, as well as illegal catches and discards (Zeller et al., 2007). In the wake of global overfishing, negligent reporting can lead to poor policy decisions that jeopardize food security (Jacquet et al., 2010; Le Manach et al., 2012), impair resource conservation, and generate incorrect assumptions that global catch trends are plateauing (Pauly and Froese, 2012) or even increasing (Watson and Pauly, 2001). In the absence of robust catch data, catches can be “reconstructed” from the bottom up using diverse data types such as interviews with fishermen, per capita consumption rates, maritime records, and other historical data (Zeller et al., 2007; McClenachan and Kittinger, 2012). The results of these studies have shown that fishing has extracted far more marine resources than previously estimated, and provided critical insights for fisheries management.
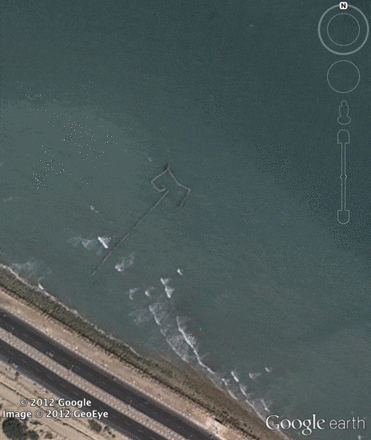
Freely available global satellite imagery via Google Earth has been a valuable multidisciplinary tool for examining a number of questions including ecological theory (Hughes et al., 2011; Madin et al., 2011), ground-truthing aquaculture production (Trujillo et al., 2012), estimating forestry biomass (Ploton et al., 2012), and assessing looting in archæological sites (Pringle, 2010). Areas that were once considered too remote or expensive—or even prohibited—to access are now ripe for scientific investigation. Satellite imagery via Google Earth allows fishing gears deployed at the surface, such as weirs, to be seen in coastal regions (Figure 1).
Fishing weirs have been used throughout the world as far back as 3000 years ago (Moss et al., 1990; Connaway, 2007) and were a fundamental gear of many coastal societies prior to the global spread of industrial fishing, starting in the 1950s. Although weir technologies differ across geographies, their basic purpose is to capture fish by limiting their movement without greatly impeding water flow. In the case of intertidal weirs, fish swimming parallel to shore at high tide encounter the “wing” and invariably try to escape by swimming into deeper water, eventually entering a smaller enclosure where they are captured by the receding tides (Beech and Al Shaiba, 2004; Al-Baz et al., 2007). Weirs are still used today throughout Southeast Asia, Africa, the Middle East (Tharwat, 2003), and parts of North America (Gabriel et al., 2005). However, their contribution to catches may be assessed erroneously for reasons related to their mode of operation (as a passive gear, they are lumped with the often neglected small-scale fisheries), ownership (e.g. tribal), and traditional forms of governance.
In the Persian Gulf, weirs (Arabic: hadrah; Farsi: moshta) are constructed in intertidal and shallow subtidal zones and catch a wide variety of marine species (Ross et al., 1881; Erdman, 1950; Bowen, 1951; Serjeant, 1968; Carpenter et al., 1997; Tharwat, 2003; Jawad, 2006; Al-Baz et al., 2007). Traditionally they were built using woven date palm, but today are made using bamboo and galvanized mesh wire. Although the Persian Gulf's semi-diurnal tides allow weirs to be checked twice a day, in practice they are checked once (Al-Baz et al., 2007). Here, we explore Google Earth's potential for quantifying fish catches in the Persian Gulf. The Gulf is an ideal location to ground-truth weir catches due to the high fraction of coastal imagery available via Google Earth, the large concentration of weirs along the coast, the historical significance of weirs in the region, and because the Gulf's marine ecosystems remain understudied.
Methods
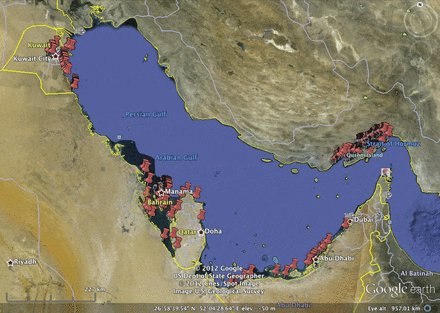
Google Earth imagery was available for the Persian Gulf for the years 2005–2010. We estimated catches for 2005 because this year had the greatest coverage of the coast at low tide, allowing most weirs to be visible. We surveyed the coast of all Gulf countries (inward of the Strait of Hormuz) three times and marked each weir with the Google marker tool (Figure 2). For each weir, we measured the three trap components (wing, yard and pocket) using the Google ruler tool calibrated to tennis courts (Trujillo et al., 2012).
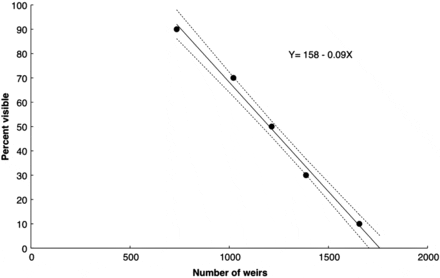
Because weir visibility is correlated with the physical conditions in which the image was taken (e.g. cloud cover, glare) and because certain areas appear under poor resolution, a visual survey is likely to underestimate the true number of weirs. Thus, we designed a visibility scheme with five categories (0–20 per cent, 21–40 per cent, 41–60 per cent, 61–80 per cent, 81–100 per cent) based on the proportion of each weir that was visible, and assigned each weir to one of the categories. Similar to a population depletion model, we plotted the percentage visible of each weir against the cumulative number of weirs, set the visibility to zero, and solved for the total (seen and unseen) weirs.
While the above method estimates weirs under sufficient conditions (i.e. adequate resolution), necessary conditions (i.e. the availability of imagery with a suitable resolution) must also be established. We accounted for missing imagery by using the Google “Grid” view and, for each country, counting the number of coastal grid squares (with sides of ≤ 5 km) with and without imagery to determine the percentages of available and missing imagery. We then raised the total number of weirs corrected for poor resolution by the percentages of missing imagery.
The mean catch rates used to calculate total catch were 62.2 kg d−1 (n = 3; s.d. = 32.4 kg) for Kuwait (A. Al-Baz, Kuwait Institute for Scientific Research, pers. comm.) and 42.6 kg d−1 for Bahrain (A. H. AlRadhi, Directorate of Fisheries Resources, pers. comm.). Estimates for fishing season lengths and species composition ratios were also obtained from the same sources, as well as for the UAE (S. A. Hartmann, Environmental Agency – Abu Dhabi, pers. comm.), while regional averages were applied for countries without these data (Iran, Saudi Arabia and Qatar). To estimate total annual catch, we combined the number of estimated weirs with daily catch rates and fishing season lengths (and the confidence intervals associated with all these parameters) in a Monte Carlo procedure (Uhler, 1980) for each country and for the entire region.
Results
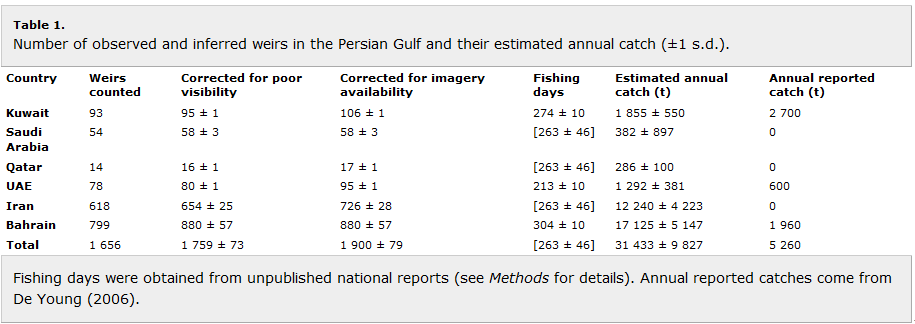
We located 1656 weirs in the coastal waters of the Persian Gulf. The correction for low visibility yielded an increase of 6.2 per cent in the estimated number of weirs (Figure 3), while the correction for imagery availability lead to an increase of 8.0 per cent. Jointly, these two factors raised the number of weirs estimated to be in the Persian Gulf in 2005 to 1900 ± 79, with an estimated catch of 31 433 t (±9827) (Table 1). Compared with regional catches reported by FAO in the same year, these estimated weir catches represent additional catches of 6–8 per cent.
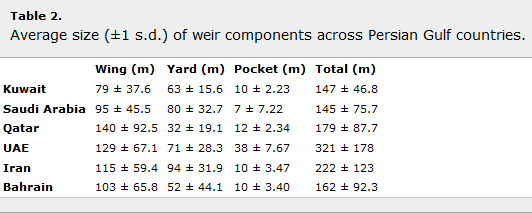
The majority of the weirs were found in Bahrain (50 per cent), followed by Iran (37 per cent) and Kuwait (5 per cent). Bahrain also leads in estimated catch (54 per cent), followed by Iran (39 per cent) (Table 1). Estimated catches for Iran, Qatar and the UAE represent an additional 4, 2 and 0.01 per cent, respectively as compared with total catches reported to the FAO. In Saudi Arabia, estimated weir catches represent only 0.07 per cent of total catches. However, because Saudi Arabia does not separate its catches between the two coastlines (the Red Sea and the Persian Gulf), the proportion of additional catch in the Gulf is likely to be greater. This is also the case for Iran, which does not separate its catches between the Persian Gulf and the Arabian Sea. Estimated versus reported catches in Kuwait were within 300–845 t. Estimated catches for Bahrain were 142 per cent greater than total catches reported to the FAO across all sectors. The largest weirs were found in in the UAE (321 m), followed by Iran (222 m) and Qatar (179 m) (Table 2).
Species composition varies between Gulf countries. Kuwait's catch is dominated by mackerel (Scombridae; 30 per cent), bream (Sparidae; 19 per cent) and morraja (Gerreidae; 15 per cent), while Bahrain's catch is dominated by rabbitfish (Siganidae; 26 per cent), swimming crab (Portunidae; 26 per cent), and sardines (Clupeidae; 15 per cent). Over 96 per cent of the UAE's catch is reported as snapper (Lutjanidae). The regional average species composition is dominated by Siganidae (22 per cent), Portunidae (22 per cent) and Clupeidae (13 per cent).
Discussion
Our regional estimate of 1900 weirs contributing to a catch of 31 433 t year−1 is up to six times greater than the officially reported catch of 5260 t. At the national level, FAO catch data are available for weirs in Bahrain, the UAE and Kuwait; our estimates are nine and two times higher than reported for Bahrain and the UAE, respectively, but rather close (within 300 t) for Kuwait. No data on catch or number of weirs were reported for Iran, Saudi Arabia or Qatar. While this is not surprising in the case of Saudi Arabia and Qatar, which we estimate to have weir catches of < 500 t year−1, it is problematic in the case of Iran, which we estimate to catch over 12 000 t year−1 with their 728 weirs. Very little information is available on the Iranian weir fishery, despite it being the largest in the region and one of the largest in the world. Although no weirs were detected in our survey of Iraq, we suggest that this is a result of poor satellite imagery (beyond our ability to correct), as literature sources indicate their presence (e.g. Serjeant, 1968; Jawad, 2006).
Overall, our results document the unreliability of catch data from the Persian Gulf, a small part of a global misreporting problem. Because catch data are submitted to the FAO by member countries (Garibaldi, 2012), the quality of these data are dependent on the accuracy of statistical data collection within these countries. Therefore, political interference (Bhathal and Pauly, 2008), perverse incentives (Watson and Pauly, 2001; Sumaila, 2013), and legacy issues (Jacquet et al., 2010) can all impair the reliability of catch data.
Although regulations governing fishing effort (e.g. fishing licences and spatial restrictions) in the Persian Gulf have been implemented since the 1960s, most stocks are either fully or overexploited (Grandcourt, 2012). This is partly because fisheries management (if any) is based on unreliable fishery data and limited stock assessments, and also because weak or ill-enforced regulations are commonplace. Fishery agencies in the area tend to be development focused, rather than seeking to implement long-term sustainability plans (Grandcourt, 2012).
In addition, our results speak to the potential for satellite imagery and remote sensing to expose illegal fishing practices. In the same way that industrial fisheries rely on technology to target catches (i.e. Fishfinders, GPS Chartplotters etc.), technological advances in satellite imagery can be used to monitor fisheries remotely, particularly in areas that were once considered too remote or expensive to enforce. In the case of Qatar, our methods revealed 17 operating weirs (14 visible directly and 3 added to compensate for poor resolution and imagery availability), despite their ban in 1994 (M.S. Al-Muhindi, Ministry of Fisheries, pers. comm.). Beyond other large semi-permanent structures, such as fish ponds in Hawaii and Japan, vywers in South Africa, or sakkar in the UAE, satellite imagery can be used to expose other illegal marine practices, such as verifying the magnitude of oil spills (Amos, 2013), assessing the use of illegal fishing gears, and monitoring activities in Marine Protected Areas (MPAs), among others. This is particularly useful for improving data collection in countries with known data inaccuracies, or in developing countries where resources allocated towards conservation and/or management are scarce.
Our results also provide further rationale for reporting catch by gear types. Fishing gear types are rarely included in compendia of fisheries statistics (Watson et al., 2006), and yet their associated impacts on marine ecosystems are highly variable and far-reaching. Because weir catches in the Persian Gulf consist mostly of juvenile commercially important species (Tharwat, 2003; Al-Baz et al., 2007), growth overfishing can occur even when certain spatial restrictions (e.g. spatial closures) are put into place. These finer scale interactions between marine habitats and fishing gear cannot be discerned by reporting tonnage alone, but our results demonstrate that Google Earth can be used to improve the quality of catch reporting and therefore overcome some of these limitations.
Despite the uncertainty associated with our approach, in particular the unavailability of mean daily catches for all countries, our method provides the best possible estimates for weir catches in the Persian Gulf at present. Zero catch estimates in the case of Iran, Saudi Arabia and Qatar, and vastly underreported catches in the case of Bahrain, are more incorrect than our conservative estimates. Should improved daily mean catch rates emerge, they can be incorporated into our methods to refine our estimates.
Our findings demonstrate both underreporting in the case of the Persian Gulf countries and that the use of freely available satellite imagery can improve catch statistics, therefore providing a more accurate view of fishery resource use. By coupling compelling images with robust data we are able to more accurately assess human impacts on marine ecosystems, thereby supporting sustainable management of marine resources. Because satellites have near-global coverage and can repeatedly capture images over the same area, they provide a cost-effective way to monitor vast areas of the ocean over time.
Funding
This is a contribution to the Sea Around Us Project, a scientific collaboration between the University of British Columbia and the Pew Charitable Trusts.
February 2014

