Executive Summary
Sustainability is a growing priority for most seafood professionals, whether they are producers, regulators, buyers, or others in the seafood industry.With an increasing dependence on aquaculture to fill the growing demand for seafood, numerous questions have arisen regarding the environmental impact of these production systems.
To chart a sustainable path forward, it is imperative that decision makers have a rigorous, yet efficient way to quantify and compare the environmental impacts of seafood products. Measuring the actual impacts of aquaculture has proven difficult, however. These challenges stem from a scarcity of data, inconsistent reporting, incomplete science, a wide range of environmental impacts across vastly different production regions, and an ever-evolving definition of sustainability.
The Global Aquaculture Performance Index (GAPI) is a new assessment tool that has been developed with this dilemma in mind. GAPI’s main objective is to condense current scientific understanding and aquaculture data into a sound, yet simple score of the environmental performance of marine finfish aquaculture. In addition to providing a single measure of performance, GAPI empowers the seafood sector with a tool to compare environmental impacts quantitatively across marine finfish aquaculture, identify better performers, and highlight potential solutions. Through the development of this tool, GAPI has amassed what is arguably the most comprehensive set of data on the ecological impacts of global marine finfish aquaculture production.
One of the major advantages of GAPI is its ability to compare both normalised and cumulative performance. Normalised scores, which are the focus of the GAPI report, measure the intensity of environmental impacts per unit of production. These scores level the playing field among producers of all sizes, so that direct comparisons can be made across countries or species regardless of the scale of production. These scores can assist policy makers in developing regulations that can improve the performance of the industry relative to their peers. In contrast, cumulative scores, which look at the overall impact of aquaculture production, encourage policy makers to grapple with important questions of industry scale and carrying capacity in their region.
Developing a framework to measure the actual performance of marine finfish aquaculture production globally has been no small feat. We have spent more than two years refining the GAPI methodology, defining ecological indicators, and collecting and transforming environmental data. This effort has involved substantial input from over 30 experts, including biologists, statisticians, seafood buyers, and a number of individuals engaged in the assessment of seafood sustainability. In addition, the GAPI methodology has been submitted for publication in the peer-reviewed literature.
Why Marine Finfish Aquaculture?
GAPI 2010 focuses solely on marine finfish aquaculture. Although this sector represents a modest portion of aquaculture production globally, the environmental impacts of the industry, such as dependence on wild fish for feed, the introduction and spread of invasive species, and marine pollution, are disproportionately large. The unprecedented and ongoing expansion of marine finfish aquaculture, coupled with the growing attention to both understanding and mitigating the environmental impacts of these farming systems, makes marine finfish aquaculture a strong candidate for GAPI assessment.
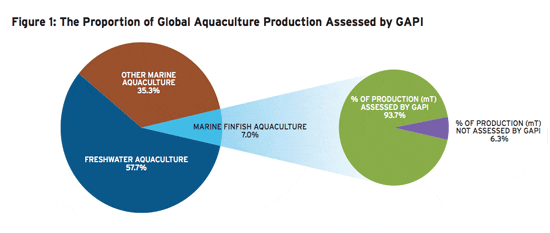
GAPI is designed to be a global assessment of marine finfish aquaculture. It currently assesses the top 20 marine finfish aquaculture species (by mT), which comprise 93.7 per cent of global marine finfish aquaculture by weight and 91.0 per cent by value (FAO 2008) (Figure 1).
Taking a data driven, quantitative approach to evaluating performance
Over the past few years, there has been a shift in the way environmental sustainability of food production is assessed. Decision makers are now placing greater emphasis on quantitative measures of environmental impact instead of relying on more theoretical, qualitative assessments. One recent example is the Keystone Center’s Field to Market study, which measures the impact of crop production against a set of sustainability indicators (Keystone Center 2009). In the seafood sector, a project conducted by Dalhousie University, Ecotrust, and The Swedish Institute for Food and Biotechnology has used the Life Cycle Analysis methodology to assess a variety of global salmon production systems (Ayer and Tyedmers 2009; Pelletier et al. 2009).
More broadly, Yale and Columbia universities have partnered on the development of a statistical tool, the Environmental Performance Index (EPI), which tracks the performance of 163 countries across 10 categories covering both environmental health and ecosystem vitality. EPI indicates which countries perform best across an array of environmental criteria and allows users to drill down into the data to assess performance within each country, region, policy category, or specific impact area (Emerson et al. 2010). EPI, which is presented biennially at the World Economic Forum meeting in Davos, Switzerland, has transformed the way in which global environmental performance is measured and compared.
Building on the EPI methodology, GAPI applies a similar approach focused on marine finfish aquaculture. Like EPI, GAPI scores performance on a scale of 0 to 100, where a higher score indicates better overall performance. Performance is measured across 10 indicators of environmental impact, which have been selected based on a survey of the ecological impacts addressed in current aquaculture assessment initiatives, including purchasing standards, industry-sponsored standards, seafood guides, and third-party certification programs (Table 1). While there are no universal criteria for the formulation of these indicators, careful attention was paid to ensuring that the indicator formulas were scientifically sound, comprehensible, and could be populated with publicly available data. Expert workshops were convened to assist in refining especially problematic or complex indicators such as waste discharges, chemical use and discharges, and pathogens.
To determine where performers fall within the 0 to 100 scale, absolute best (100) and worst (0) performance must be defined. Setting the best performance bar is straightforward, as the best any performer can do is to have absolutely no environmental impact. While zero-impact targets may be unrealistic as farming standards, GAPI provides crucial information regarding how close marine finfish aquaculture comes to meeting an ideal performance (zero-impact) and allows users to track real progress or decline in performance against fixed, aspirational targets.
| Inputs | Discharges | Biological |
|---|---|---|
| Capture-Based Aquaculture (CAP) | Antibiotics (ANTI) | Escapes (ESC) |
| Ecological Energy (ECOE) | Antifoulants (Copper) (COP) | Pathogens |
| Industrial Energy (INDE) | Biochemical Oxygen Demand (BOD) | |
| Sustainability of Feed (FEED) | Parasiticides (PARA) |
Determining worst performance (i.e., a score of 0) is trickier, as a production system could perform infinitely poorly within all indicators. To solve this dilemma, GAPI reviews the pool of performance data and uses the worst actual performance in each indicator to set the worst performance benchmark (0). Thus, like a classroom grading system, GAPI grades on a curve, where a performer’s GAPI score is partially dependent on the performance of the pool of players among which it is being assessed. To achieve a perfect score (100), a performer must attain the zero-impact target in each of the 10 indicators.
Since GAPI assesses each performer relative to its peers, the inclusion of additional species or different types of production systems (e.g., polyculture, recirculating systems) would realign GAPI scores. To this end, the next phase of GAPI will be to develop a farm-level aquaculture performance index to enable a more refined look at environmental performance among individual farms. The GAPI methodology will also be used to assess and compare the current array of environmental standards (including those in draft stages) for marine aquaculture, including those that various certification schemes are promoting.
A Flexible Tool
By zooming out of or into the GAPI analysis, users can completely change the lens through which they view environmental performance. This flexibility allows a variety of stakeholders to apply GAPI with an almost infinite number of applications. For instance, GAPI can help to answer such questions as: Are there common modes of production and geographic characteristics that enable a specific sector or country to perform better than others? GAPI also helps to uncover broader trends, such as the effects of market value, type of production system, and trophic level, on environmental performance. While the GAPI 2010 report reviews the GAPI analysis and findings, it only scratches the surface in terms of how GAPI can be used and applied.
The core building block of GAPI is the Species-Country Score (e.g., Atlantic salmon–Norway score), which describes the overall performance for each species-country pair across all 10 indicators. GAPI also groups performance by country or species so that broader observations can be made across countries and across marine finfish species. Species GAPI Scores and Country GAPI Scores are simply the average of all individual species-country scores related to a particular species or country, respectively, weighted by the proportion of production assessed within GAPI. For all of these levels of observation—species-country, species, and country—GAPI provides cumulative and normalised scores in addition to an indicator-by-indicator breakdown of scores.
Global perspective
At the coarsest resolution, GAPI provides novel insights into the aggregate impacts of the marine finfish industry. For instance, data collected by GAPI suggests that:
The global marine finfish aquaculture industry used an estimated 5.5 million kg of antibiotics (aggregated across the 44 species-countries assessed). This material, much of which was discharged directly into the marine environment, is comprised almost exclusively of compounds considered critical for human and/or veterinary medicine.
Approximately 16.4 million kg of parasiticides were used, the majority of which are broad-spectrum toxins with unknown cumulative impacts on non-target organisms.
The equivalent of 1.1 × 10¹⁴ g C of primary productivity was appropriated for the production of the assessed species. More than 98 per cent of this material (in terms of net primary productivity [NPP]) was derived from marine organisms, almost entirely fish. Assuming a mean oceanic productivity of 140 g C per m2 per year, this suggests that the marine finfish production assessed by GAPI consumed approximately 770,000 km2 of oceanic productivity—an area the size of the East China Sea.
This coarse assessment is helpful to stakeholders attempting to determine where future attention and conservation efforts should be placed. It should also be of interest to global initiatives attempting to measure the performance of their standards against the rest of the industry.
Country Performance
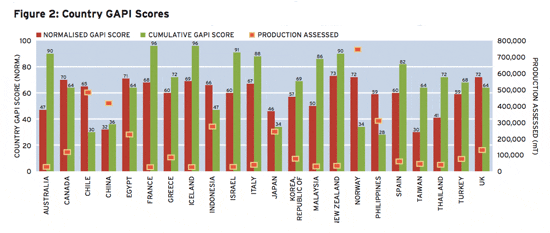
By zooming in a bit further, GAPI offers a glimpse into the marine finfish aquaculture industries of each of the 22 countries assessed. By grouping performance by country, GAPI distinguishes those countries or regulatory schemes that are best (and worst) at addressing the major environmental impacts of marine aquaculture.
For instance, China’s GAPI score (normalised per mT of production) is 32, 27 points below the global average for all countries and well below ideal performance (100) (Figure 2). Since GAPI assesses eight different species produced in China, which comprise 61 per cent of all of China’s marine finfish production, users can have some confidence that China’s GAPI score is a strong reflection of its marine aquaculture industry.
Similarly, users can gain an understanding of the effects of scale of production in a country. For instance, Chile’s score per mT of fish produced is 65. Its cumulative score (30) is less than half its normalised score, demonstrating the effects of the large scale of its salmon industry.
Country scores are a powerful tool for regulators looking to compare their country’s overall performance to that of their peers. Normalised country scores are especially useful to regulators interested in comparing their performance to that of other countries, regardless of the scale of their production, where cumulative country scores provide insight into the overall impact of a country’s marine aquaculture industry. Country scores can also be dissected by indicator, which enables a regulator to assess where it might focus its efforts (e.g., reduction of wild feed inputs or greater treatment of discharges) to achieve the greatest ecological improvement (i.e., higher GAPI score). Similarly, regulators can compare their country’s performance across species to identify trends and evaluate the efficacy of marine aquaculture regulations in particular impact areas.
Species Performance
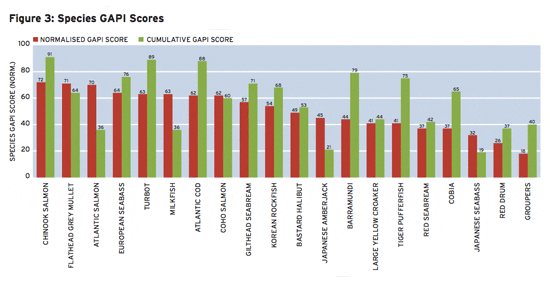
GAPI also aggregates performance for each of the 20 marine finfish species assessed, allowing for global observations across species and highlighting those species that have the best and worst performance globally (Figure 3). With a global average score of 50 for all marine finfish species, GAPI suggests there is substantial room for improvement within the marine finfish aquaculture as a whole.
Species scores are especially suited for seafood buyers interested in comparing performance across seafood products (e.g., turbot versus Atlantic salmon). Buyers could use these scores to inform purchasing perferences across species, such as choosing high-scoring species (e.g., Chinook salmon, flathead grey mullet) over low-scoring species (e.g., cobia, groupers) (Figure 3).
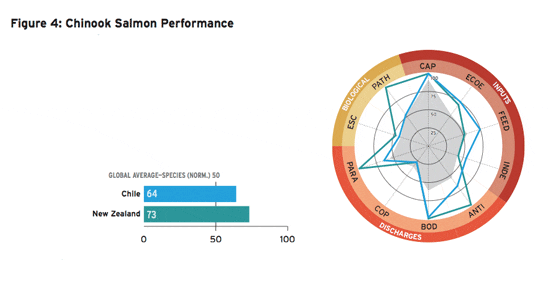
GAPI also provides a breakdown of each species’ performance, so that users can compare an individual species’ performance across producing countries and across indicators. Figure 4 is an excerpt from the GAPI 2010 report depicting Chinook salmon scores. The bar graph compares the performance of the species based on where it is produced (i.e., its species-country score). Buyers can use this more detailed information to determine from which countries to purchase a particular species. For instance, a buyer interested in Chinook salmon may chose to purchase it from New Zealand (normalised score 73) instead of Chile (normalised score 64).
The radar graph in Figure 4 maps the normalised performance of a species-country pair (e.g., Chinook salmon–Chile) within each of the 10 indicators. The centre point represents a GAPI score of 0, and the outermost ring represents the aspirational target (100). The larger the area inside the line, the higher the GAPI score. The grey shaded area depicts average global marine finfish performance (normalised).
Radar graphs are especially useful for stakeholders interested in how well a species performs compared to its peers in specific impacts. For instance, if buyers’ customers are largely concerned about escapes of farmed salmon, then they might be little comforted by Chinook salmon’s species score (72), given that its escapes score (ESC) is below 50 for both producing countries. Additionally, a buyer most concerned about feed sustainability (FEED) may chose Chinook salmon from Chile instead of New Zealand, given the former’s significantly better score in that indicator.
Effects of Scale
By providing both normalised and cumulative scores of performance, GAPI allows users to explore the effects of the scale of production on environmental performance at an individual product level (e.g., barramundi from Australia), by country (e.g., Chile’s normalised versus cumulative score), and species (e.g., Atlantic salmon’s normalised versus cumulative score).
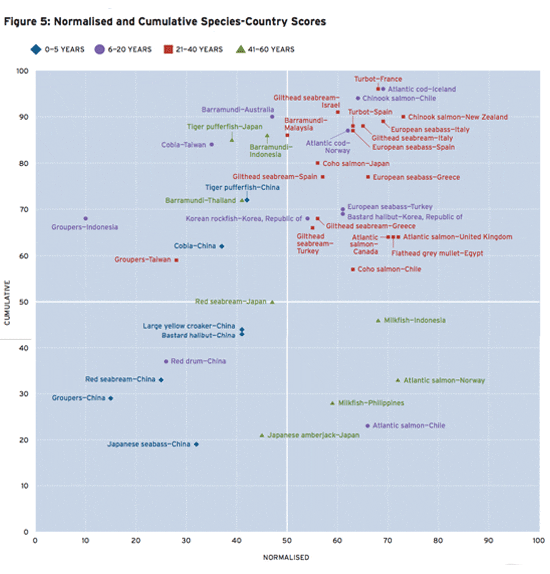
Figure 5 depicts normalised and cumulative GAPI scores for all species-country pairs and differentiates them by the period of time (years) each pair has been in culture.
Production systems are expected to evolve and improve in efficiency over time. Thus, one would expect to see GAPI scores increase the longer a production system has been in existence. All start-up production (zero to five years) assessed by GAPI took place in Asian countries, predominantly China. In these cases, both normalised and cumulative performances tend to be relatively poor. This is probably due to the fact that performance is so poor that even a relatively small volume of production carries a large ecological footprint.
As a system matures, ecological performance tends to improve in both cumulative and normalised impacts. It is during this intermediate stage that overall performance appears to peak. Interestingly, most mature systems assessed by GAPI (41–60 years) tend to retain a high normalised or a high cumulative score, but not both. Some sacrifice cumulative performance in pursuit of tremendous production (e.g., Atlantic salmon from Norway and milkfish from the Philippines). Others sacrifice normalised performance by farming products that are so ecologically damaging (Japanese tiger pufferfish and barramundi from Indonesia and Thailand) that high-volume production may not be feasible.
Conclusions
The results of GAPI analyses underscore several policy-relevant conclusions:
Sustainability must be demonstrated, not assumed. Data availability and quality remain preeminent challenges to any assessment of sustainability. However, verification of the sustainability of any production system requires that abundant, high-quality data are available for analysis. Data deficiencies are particularly challenging in the traceability of feed stocks, feed formulations, and the cumulative ecosystem effects of both chemical use and escapes. The long-running debate regarding sustainability has been largely informed by qualitative information and spotty data. The long-term ecological and economic viability of the industry depends on shifting policy and production decisions towards quantitatively rigorous performance-based regulatory frameworks such as GAPI.
Not all marine finfish aquaculture is the same. While it might be reasonable to assume significant performance difference across drastically different types of aquaculture such as shellfish farming and marine finfish farming, GAPI scores reveal tremendous variation in environmental performance just within the marine finfish sector. These variations are highlighted in species-country pair scores, country scores, and species scores. For instance, normalised species-country scores range from a low of 10 (groupers–Indonesia) to a high of 73 (Chinook salmon–New Zealand) (Figure 5). Similarly, normalised country scores range from 30 (Taiwan) to 73 (New Zealand) (Figure 2), and normalised species scores range from 18 (groupers) to 72 (Chinook salmon) (Figure 3).
There is substantial room for improvement. While there is strong variation in GAPI scores across countries and species, and while GAPI does not define passing or failing scores, the findings strongly suggest that there is room for improvement within the entire marine finfish sector. Even the best performers are approximately 30 points away from the aspirational target performance (100). As aquaculture expands, attention should be paid to ensure that, at a minimum, the industry does not shift further towards the poorer performers, at least until their practises improve significantly.
The worst-performing sectors of the industry are also the fastest-growing. Marine finfish farmed in tropical and sub-tropical water, such as groupers (normalised score, 18), red drum (normalised score, 26), and cobia (normalised score, 37), have some of the worst scores on both a normalised and cumulative level, yet production of these three species has grown by more than 40 per cent per year for the last five years on record (Figure 3). Low scores in this sector are due to poor performance across most indicators. In particular, warmwater species consume large quantities of feed and require large amounts of antibiotics. Additionally, coldwater species tend to be produced in industrialised countries and to have benefited from improved production efficiency. The same cannot be said for warmwater species, on average.
Asia faces significant sustainability hurdles. Asian countries account for the 15 lowest species-country scores. The trend towards lower normalised scores in Asian countries largely results from the prevalence of poor performance in the Inputs category, such as ecological and industry energy, feed sustainability, and biochemical oxygen demand. Asian countries also tend to score poorly in the antibiotics and parasiticides indicators since GAPI assumes that performers use the maximum allowable dose or quantity in the absence of actual performance data. In general, Asian countries’ cumulative scores are relatively higher than their normalised scores by virtue of the modest production in those countries.
Atlantic salmon performance illustrates that scale is everything. GAPI’s comparison of cumulative to normalised scores demonstrates that the sheer scale of production can have drastic effects on environmental performance. Some of the best-performing species on a normalised basis are among the worst on a cumulative basis due to the sheer scale of those industries. For example, Atlantic salmon is the third-highest-ranking species on a per mT basis (normalised score, 70), but when production volume is taken into account, Atlantic salmon’s score drops almost 50 per cent, which ties it as the third-worst of the 20 species assessed by GAPI (Figure 3).
In contrast, cobia is one of the worst performers on a normalised basis (37). Per mT of production, cobia has one of the biggest environmental footprints of any marine finfish. However, because cobia farming is a modest-sized industry, it has a small cumulative impact (cumulative score, 65) compared to bigger farming sectors like Atlantic salmon (Figure 3).
In other words, large production of better-performing species could create more environmental damage than a single poorly performing farm. This discrepancy raises a question at the heart of sustainability: How do we expand aquaculture to support the food and protein needs of 9 billion humans without overwhelming the carrying capacity of the marine environment? Clearly, part of the answer lies in selecting the right species, choosing the right environments in which to grow them, and utilising responsible farming practices. At the same time, regulators need to consider the carrying capacity of local waters and begin to design and reward operations that minimise the environmental footprint of marine finfish aquaculture.
The GAPI 2010 report represents a work in progress. GAPI is intended to both inform and stimulate discussion of the appropriate metrics for evaluating performance and to drive the gathering and sharing of data. While the 2010 GAPI report provides a snapshot in time of environmental performance, the GAPI website (www.gapi.ca) is the repository for the wider body of data and analyses that will be updated as additional or better data become available. User feedback is encouraged and will be incorporated into the online tool.
We are hopeful that GAPI will transform the way environmental performance is assessed and will aid decision makers—whether they are policy makers, producers, large buyers, or standard setters—as they continue to address the promise and challenges of marine finfish aquaculture.
Further Reading
| - | You can view the full report by clicking here. |
