Exports and Imports
Historically, Australia has been a net importer of fisheries products in volume terms but a net exporter in value terms. This disparity reflects the composition of Australian fisheries exports compared with imports.
Australian fisheries exports are dominated by high value products, such as rock lobster, tuna and abalone, while imports largely consist of lower value products, such as frozen fish fillets, prepared and preserved fish and frozen prawns.
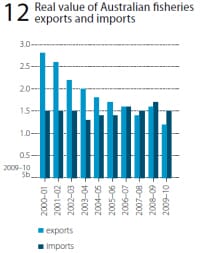
In recent years, the gap between imports and exports in value terms has closed and in 2007–08 Australia became a net importer of fisheries products in value terms (figure 12).
In 2009–10, this trend continued although the value of Australian imports of fisheries products fell by $195.1 million (11 per cent) compared with 2008–09. Australian exports of fisheries products also decreased, by a greater amount ($282.7 million), further increasing the net import gap in the value of Australian fisheries product trade.
In 2009–10, the total value of Australian exports of fisheries products was $1.2 billion. About 79 per cent of this value was derived from exports of edible fisheries products, such as fish, crustaceans and molluscs, which were valued at $987.7 million. Exports of non-edible fisheries products, such as pearls, fish meals and marine fats and oils, accounted for the remaining 21 per cent ($259 million) of this value.
In real terms, the value of Australian fisheries exports has fallen by 55 per cent ($1.5 billion) since 2000–01 to $1.2 billion, with most of the fall occurring over the period to 2004–05 (figure 12). The main factors contributing to this decline were a 38 per cent (24 739 tonnes) decrease in the volume of edible exports and falling unit export prices for most major export products, particularly prawns, tuna and abalone.
The decline in unit export prices is the result, in part, of an appreciation in the Australian dollar against both the Japanese yen and US dollar over this period. Since 2004–05, the value of Australian fisheries exports decreased by 18 per cent ($282.7 million) as a result of lower export unit prices following an 18 per cent appreciation of the Australian dollar against the US dollar over the period to 2009–10.
In 2009–10, the total value of Australian fisheries imports decreased by 11 per cent ($195.1 million) to $1.5 billion, with most of the fall attributed to lower import values of non-edible fisheries products (predominantly pearl re-imports).
Approximately 82 per cent of import value consisted of edible fishery products, which declined in value terms by three per cent ($37.0 million) to $1.2 billion driven mainly by lower import unit prices as a result of a sharp appreciation of the exchange rate.
Since 2004–05, the value of Australian fisheries imports, in real terms, has risen by 12 per cent ($156.4 million), following a decline over the period 2000–01 to 2003–04. The main factor contributing to this increase was an 11 per cent (21 227 tonnes) increase in the quantity of edible imports (excluding live products), with this increase in volume distributed between fish products and crustacean and mollusc products.
Exports by commodity
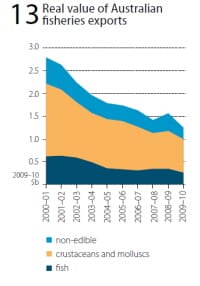
The total export value of fisheries products (edible and non-edible) fell by 18 per cent ($282.7 million) in 2009–10 to $1.2 billion (figure 13).
This was driven by a 14 per cent ($157.6 million) and 33 per cent ($125 million) decrease in the value of edible and non-edible exports, respectively. The decline in the value of edible exports was considerable across fish, crustaceans and molluscs.
In 2009–10, the export value of fish products fell by $75.6 million (23 per cent), mainly caused by decreases in the export volume of tuna and salmon products. The export value of crustaceans and molluscs decreased by a greater amount—$82 million (10 per cent)—mainly as a result of declines in the export volume of rock lobster and prawns, which declined by 19 per cent (1832 tonnes) and three per cent (138 tonnes), respectively.
An increase in the export value of abalone offset to some extent the overall decline in the export value of Australian fisheries products, rising by $8 million to $216 million in 2009–10. The decline in the value of non-edible exports is a result of a 33 per cent ($122.6 million) decrease in the export value of pearls.
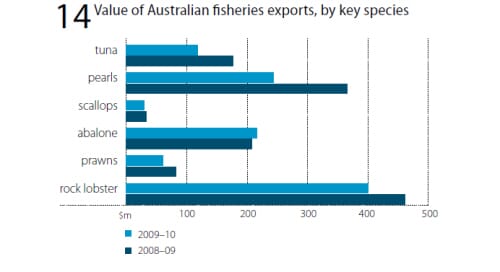
Rock lobster remained the most valuable export product by value in 2009–10 at $400 million— despite a decrease in export value of $62 million—followed by pearls ($244 million), abalone ($216 million), tuna ($118 million) and prawns ($61 million) (figure 14). These products together accounted for 83 per cent of the Australian total export value of fisheries products in 2009–10.
Edible fisheries products
Key products: rock lobster, abalone, tuna and prawns
Fish products
The total export volume of fish products decreased by 19 per cent (4937 tonnes) in 2009–10 to 20 769 tonnes. The decline in volume was greatest for salmon product exports, which accounted for 18 per cent of total fish product exports in 2009–10, falling by 41 per cent (2593 tonnes).
In value terms, exports of fish products fell by 23 per cent ($75.6 million) in 2009–10 to $258.4 million. The larger decrease in value terms was because much of the decline in the volume of fish exports was for tuna and salmon, which are relatively high-value fish products.
In 2009–10, fish product exports accounted for just over half of total fisheries product exports by volume and 21 per cent by value, respectively. Tuna and salmon were the highest single species groups of fish product exports, together accounting for 64 per cent of fish product exports, by volume.
Tuna exports (including canned) dominated edible fish exports, accounting for 46 per cent ($118.5 million) in value terms. In 2009–10, tuna exports fell by 17 per cent (1976 tonnes) in volume terms and 33 per cent ($58.3 million) in value terms. Falls in the export value (49 per cent) and volume (25 per cent) of whole frozen tuna were the main causes of these decreases.
Salmonids exports (including prepared and preserved) accounted for a relatively smaller share of the value of edible finfish exports—10 per cent or $26.6 million. In volume terms, salmon exports accounted for 18 per cent (3687 tonnes) of edible fish exports.
Exports of salmon products decreased significantly in 2009–10, by 41 per cent (2593 tonnes) in volume terms and 40 per cent ($17.5 million) in value terms. This decrease was driven mainly by a 38 per cent ($15.8 million) decline in the export of fresh or chilled whole salmon, which accounted for 97 per cent of total salmonids exports by value in 2009–10.
Exports of other fish products remained fairly stable, at $113.4 million, in 2009–10 compared with 2008–09. Increases in the export values of fresh, chilled or frozen fish products (excludes tuna and salmon), by a total of $14.9 million, have largely offset decreases in the export value of prepared and preserved fish products, and dried, salted and smoked products (excludes tuna and salmon).
The export value of live fish also declined, by 13 per cent or $6 million, to $40.4 million. In total, exports of other fish products accounted for 44 per cent of total edible finfish exports.
Crustacean and mollusc products
In 2009–10, exports of crustaceans and molluscs fell by nine per cent (1995 tonnes) in volume terms. At the same time, the total value of crustacean and mollusc exports fell by 10 per cent ($82.1 million). Crustacean and mollusc exports accounted for 48 per cent and 74 per cent of edible export volume and value, respectively.
The major crustacean and mollusc exports were rock lobsters, prawns, crabs, abalone and scallops. Rock lobster exports accounted for 55 per cent of the total export value of crustaceans and molluscs in 2009–10.
Compared with 2008–09, the export value of rock lobsters fell by 13 per cent ($62 million) to $399.7 million, driven by a 19 per cent (1832 tonnes) decrease in export volume for rock lobster. Abalone exports accounted for 30 per cent of the total value of crustacean and mollusc exports.
The value of these exports rose by four per cent ($8.2 million) to $216.3 million in 2009–10, largely because of a 10 per cent (319 tonnes) increase in its export volume. In contrast, the value of prawn exports decreased by 25 per cent ($20.7 million) to $61.5 million. This is linked to a 23 per cent and three per cent (138 tonnes) decrease in the average unit prices and volume for exported prawns between 2008–09 and 2009–10, respectively.
The total export value of crabs and scallops also decreased, by 13 per cent or $6.3 million. These two commodities contributed $43.3 million (six per cent) of the total value of crustacean and molluscs exports.
Non-edible Fisheries Products
Key products: pearls
The value of non-edible fisheries product exports fell by 33 per cent ($125 million) to $259 million in 2009–10. This decline was largely attributable to a $122.6 million decrease in the value of pearl exports.
Pearl exports were valued at $243.9 million and were the most valuable non-edible export product, accounting for 94 per cent of the total non-edible export value and 20 per cent of total value of fisheries products exports in 2009–10.
The remaining six per cent of the total export value of non-edible fisheries products included marine fats and oils, fish meal, ornamental fish and other non-edible products.
Exports by Destination
Edible fisheries productsMain destinations: Hong Kong, Japan
In 2009–10, Australia’s major seafood export destinations were Hong Kong ($491 million), Japan ($215 million), the United States ($49 million), China ($43 million) and Singapore ($38 million) (figure 15), which together accounted for 88 per cent of the total value of Australian seafood exports in 2009–10.
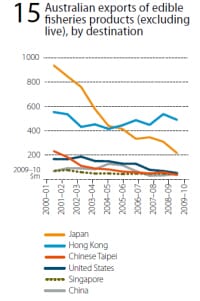
Most finfish products were exported to Japan (mainly tuna and salmon), New Zealand (prepared and preserved fish), Thailand (whiting) and China (whiting). Hong Kong and Japan remained the primary markets for Australia’s exports of crustaceans and molluscs.
In 2009–10, Hong Kong remained Australia’s major export destination for edible fisheries products, accounting for 52 per cent of the total export value of edible fisheries products.
Rock lobster and abalone were the main export species groups, accounting for 62 per cent and 27 per cent of the total value of exports to Hong Kong, respectively.
In 2009–10, the export value of rock lobsters fell by five per cent ($14.5 million) to $305.8 million; while exports of abalone fell by three per cent ($4 million) to $131.6 million.
Exports of scallops, dried, salted or smoked fish, crabs and prawns accounted for most of the remainder of the total edible fish product exports to Hong Kong.
Japan accounted for 23 per cent of the total export value of edible fisheries products in 2009–10. The main edible fisheries products exported were tuna (whole), rock lobster, abalone and prawns, accounting for 90 per cent of the total value of edible exports to Japan.
Whole tuna was the most important export product, contributing more than half ($112.2 million) of the total export value. Japan is one of Australia’s most important whole tuna export markets and accounted for 96 per cent of Australian exports of whole tuna in value terms.
Other important export destinations in 2009–10 included the United States, Chinese Taipei, Singapore and China. Chinese Taipei and the United States are important export markets for rock lobster, accounting for eight per cent and seven per cent, respectively, of the volume of Australia’s rock lobster exports in 2009–10.
China and Singapore are the main export markets for abalone, with 14 per cent and 12 per cent of the volume of Australian abalone exports in 2009–10, respectively. Chinese Taipei and China accounted for 26 per cent and 15 per cent of the volume of Australian crab exports in the same year, respectively.
September 2011
