Although large reductions in the abundance of land predators
have mostly occurred over historical timescales, populations
of large pelagic predators such as tuna, billfish, and sharks have
declined much more recently because of intensified exploitation.
For highly commercial species in particular, this process
often involves the collection of detailed data that allow us to
investigate general hypotheses about the wider ecological effects
of predator depletion. Here we use these data to investigate
changes in species geographic ranges, defined as the sum of all
localities where the species is known to regularly occur.
On land, there are well-documented reductions in range size
that have resulted from the declining abundance of large mammals,
such as wolves and bears. Ceballos and Ehrlich, for
example, described a 50% range reduction on average for 173
declining mammal species on six continents. Similar range contractions
have been observed in some exploited marine mammals,
including seals, cetaceans, and sea otters. These
changes in abundance and range can have powerful ecosystem
effects, such as well-documented trophic cascades driven by the
local loss of sea otters and wolves.
Such range losses seem to conform to a larger macroecological
pattern, the rangeabundance relationship, which posits that
species of low abundance generally tend to occupy smaller ranges. From a conservation perspective this puts species that
have declined to critically low abundances into a double jeopardy,
because the population is not just smaller but also occurs in
fewer places. Often, this smaller range also tends to be
more fragmented than the original distribution of the species,
reducing gene flow and dispersal among subpopulations.
On land, some proportion of these changes are likely driven by
habitat fragmentation and destruction, which may enhance these patterns in addition to the effects of reducing abundance via the
hunting or culling of animals.
For marine fishes, particularly for pelagic and highly mobile
species such as tuna and billfish, it is an open question whether
similar patterns apply. Large reductions in abundance are a
standard outcome of fisheries management for maximum yield, but how this may affect the range size of a species is
unclear. Many pelagic species are highly mobile and easily disperse
across ocean basins, as has been revealed by tagging and
tracking experiments. Thus, a reduction in abundance
may occur more evenly across their range, owing to the constant
mixing of individuals. If there was significant population structure
and fidelity of subpopulations to particular areas, however, spatially
uneven fishing pressure could possibly eliminate subpopulations
that exclusively use or congregate at a particular part
of the species range.
Here we used two global data sets on the spatial distribution of
commercial tuna (Thunnini) and billfish (Istiophoridae, Xiphiidae)
catches at a 5 longitude 5 latitude scale to examine
changes in the observed distribution of these species over time.
We calculated the effort needed to reliably detect a species in
each individual 5 5 cell and then examined decadal changes in
range occupancy for each cell that has sufficient fishing effort
from the 1960s to the 1970s, 1980s, and 1990s. This follows previous
work documenting significant reductions in abundance and
diversity for these species, which potentially could also
translate into significant range reductions. We tested the null hypotheses
that there would be no changes in the observed range
size over time.
Results
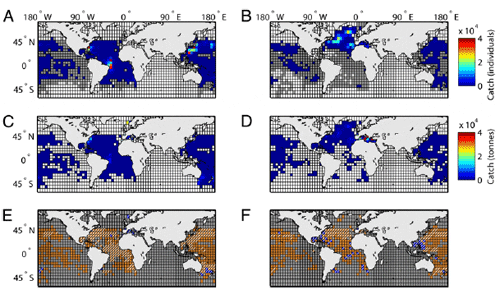
To asses tuna and billfish ranges we mapped out species observed occurrences from a multidecadal database of global Japanese longline fisheries targeting these species, as well as from the United Nations Food and Agriculture Organization (FAO) Tuna and Billfish Atlas, which includes spatial catch data from all fleets (Fig. 1 AD). Data were binned by decade to detect long-term change and to average across possible seasonal and year-to-year variability in fleet targeting and fish distribution. We found that the two data sets complemented each other in achieving global coverage. Data were processed as follows: a species presence was recognized when reported catches exceeded five individuals (Japanese data) or five tons (FAO data) per decade. Alternative occurrence thresholds did not have a substantial effect on the results. A species absence was recognized when it was not reported as being caught (or present below the occurrence threshold, which should exclude stragglers or misidentifications), yet sufficient longlining effort was recorded to ensure a 99% probability that the species would have been detected if present (details in Methods). Using these data we can only assess changes in the observed range, which includes cells that showed presence of a species at the above thresholds in at least one decade and that had sufficient sampling effort to reliably detect presence or absence in other decades. Hence, only cells with sufficient fishing effort were included in calculations of range changes (Fig. 1 E and F). Note that the total range of a species may exceed its observed range.
Of 13 tuna and billfish species with sufficient data, we found
that 9 species declined significantly in their observed range in at
least one ocean, 4 did not change, and 2 increased significantly
in at least one ocean (Fig. 2 and Table 1). Most species showed
consistent responses across different oceans, with the exception
of skipjack tuna (Katsuwonus pelamis) and sailfish (Istiophorus
platypterus), which declined in the Atlantic and Indian Oceans
but expanded in the Eastern Pacific (Table 1).
Range changes (both increases and decreases) occurred
mostly around the fringes but rarely in the core of a species range (Fig. 2). The largest range contractions were observed in the
Atlantic, where three species lost 40% or more of their observed
range between the 1960s and 1990s (Table 1). In the Indian
Ocean significant range losses over the same time frame were
estimated between 5% and 30%; in the Pacific these ranged
between 2% and 33%. Significant range expansions occurred
only in the Pacific, with sailfish expanding by 11% and skipjack
tuna by 29%, mostly in the Eastern Pacific basin (Fig. 2 F and H).
Among the tunas, Atlantic bluefin tuna (Thunnus thynnus)
stood out by losing 46% of its total observed range, including
almost all of its former distribution in the Southern Atlantic
(Fig. 1, Fig. 2C, and Table 1). Pacific bluefin (Thunnus orientalis)
and southern bluefin tuna (Thunnus maccoyii) also both decreased
their ranges between the 1960s and 1990s, albeit not as
markedly as T. thynnus (Fig. 2 C and G). None of the other tunas
showed significant range contractions, with the exception of
skipjack in the Indian (but not Atlantic or Pacific) Ocean (Fig.
2H and Table 1).
Observed Range Change in Tuna and Billfish, 19601999
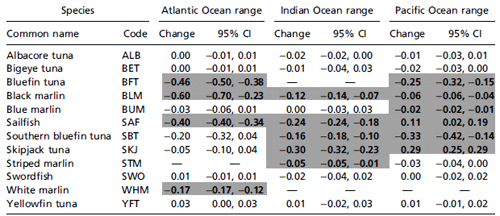
Significant range changes in each ocean are highlighted in bold (P < 0.05). Thirteen species were analyzed. Note that bluefin tuna includes an Atlantic (T. thynnus) and Pacific species (T. orientalis). CI, confidence interval.
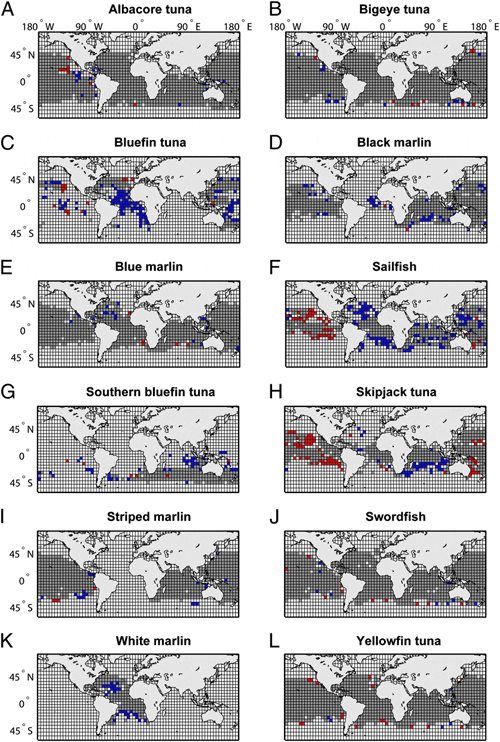
Among the billfish, the black marlin (Istiompax indica) range
contracted the most, particularly in the Atlantic (60%). Note,
however, that the species occupied very few cells there even in the
1960s; because this species is generally considered an Indo-Pacific
endemic these records may represent misidentifications or vagrants
from the Indian Ocean, where the species also declined
substantially (Fig. 2D and Table 1). Range declines for black
marlin were also significant in the Pacific, although less pronounced.
This appeared as a general pattern across species: declines
in the Pacific were generally less severe (or not present at
all) compared with the Atlantic and Indian Ocean (Table 1).
Sailfish even increased in observed range in the Pacific, while
declining in both the Atlantic and Indian Ocean (Fig. 2F). White
marlin (Kajikia albida) and striped marlin (Kajikia audax) declined
in their observed range in the Atlantic and Indian Ocean, respectively
(Fig. 2 K and I). Blue marlin (Makaira nigricans) did not
decline substantially (although a 2% range decrease in the Pacific was statistically significant) . Swordfish (Xiphias gladius) was the
only billfish that showed no significant change in any ocean (Fig. 2J
and Table 1).
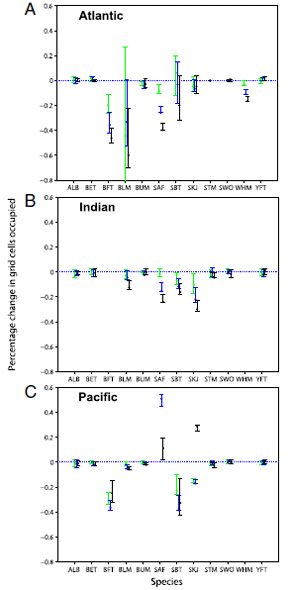
For species that showed range contractions, these tended to
occur progressively throughout the 1970s, 1980s, and 1990s (Fig.
3). None of these trajectories reversed significantly. Range
expansions showed less of a temporal trend, for example skipjack
in the Pacific seemed to decrease in the 1970s and 1980s but
greatly expanded in the 1990s (Fig. 3C).
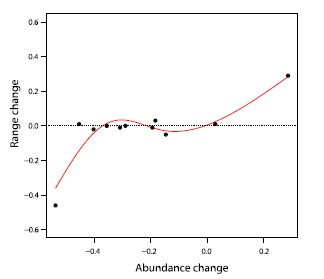
Available tuna and swordfish stock assessments (n = 11) indicated
that large changes in stock abundance may correlate with
large changes in the occupied range (Fig. 4). This was true both for
a strongly increasing species (skipjack tuna) as well as a decreasing
one (Atlantic bluefin). Intermediate changes in abundance did not
seem to have a large effect on ranges for the species of tuna examined
here (Fig. 4). Unfortunately there were no long-term
stock abundance estimates available for any of the marlin species.
Discussion
In this study we applied a macroecological perspective to marine pelagic fisheries, an approach that has become more common in contemporary fisheries research, yielding insights into largescale changes in abundance, distribution, and diversity. We present evidence for progressive contractions in the observed ranges of 9 of the 13 species of tuna and billfish examined. Range contractions were particularly pronounced for the larger species, such as all bluefin tunas and black marlin. For tuna there seemed to be some evidence that large range changes correlated with large changes in abundance, although there were too few data points available to make a definitive statement about the form of this relationship (Fig. 4). It did emerge that species that are of known conservation concern are more likely to show range contractions. Atlantic bluefin tuna, for example, seemed to now be largely confined to the North Atlantic (Fig. 1 and 2), yet there were significant fisheries for this species in the South Atlantic as recently as 40 y ago. Recent tagging studies in the North Atlantic confirmed that this species today is not typically migrating south of 20 N. Likewise, it is missing from the Baltic, North, and Black Seas, where it was previously caught in significant numbers.
No significant range changes were seen in albacore (Thunnus
alalunga), yellowfin (Thunnus albacares), and bigeye tuna (Thunnus
obesus) or swordfish (Xiphias gladius). According to available
stock assessments, these species have also not declined in abundance
as much as bluefin tuna (range: 54% decrease to 28%
increase, as opposed to >70% decrease for bluefin species).
Furthermore, they tend to spawn and produce larvae throughout
the ocean, whereas bluefin tuna tend to spawn in a few well-known
areas. This reproductive trait would make them more vulnerable
to fisheries and may also lead to distinct subpopulations that could
be extirpated by fisheries. For this reason, it has been suggested
that a metapopulation model would be more appropriate for
capturing the dynamics of bluefin populations. It is conceivable
that the elimination of vulnerable subpopulations is one potential
mechanism that explains observed range declines in bluefin
species, which involved the loss of big parts of the formerly occupied
range. A second potential mechanism involves densitydependent
habitat selection, whereby changes in population
density determine the probability of individuals migrating from the core habitat to less suitable habitats at the fringe of the distribution. This latter mechanism could explain dynamic
changes in range size in response to changes in abundance and
may drive observed expansions and contractions around the
fringes of a species range. This is seen for example in skipjack tuna
and sailfish (expansions), or white and black marlin (contractions).
At this point we cannot be certain as to the ultimate cause of
the observed range changes. In principle they could be due to
changes in ocean conditions, removal by fisheries, species interactions,
or other factors. We note that the three bluefin species,
which all have declined greatly in abundance over the last 3050 y,
displayed the strongest range contractions among the tunas.
Unfortunately we could not access any appropriate abundance
time-series for marlin. However, white and blue marlin, as well as
sailfish in the Atlantic, are all assessed as overfished with further
overfishing occurring, whereas swordfish stocks are considered
within safe limits. White marlin and sailfish (but not blue
marlin) also show significant range contractions in the Atlantic,
whereas swordfish do not. These results are generally consistent
with the hypothesis that overfishing is at least partly driving observed
range contractions and that large changes in abundance
can produce significant changes in the range size of pelagic predators. This mirrors results on land, where it has been established
that even wide-ranging and highly mobile species will
eventually show range loss when hunted to low levels.
The only region where range expansions were detected was the
Eastern Pacific. This could be partly due to proactive management
regimes under the auspices of the Inter-American Tropical
Tuna Commission. Here, sailfish and skipjack tuna expanded
considerably, whereas they declined in the Atlantic and Pacific
(Fig. 2). It is noteworthy that these represent the smallest and
most fast-growing species of the billfish and tuna included in this
analysis, whereas larger species were either stable or declined.
Species expansions occurred most notably in the Northeast Pacific,
where a climate regime shift occurred between the 1960s and
1990s. This resulted in warmer average ocean conditions and
changes in prey fields, which may have contributed to the
observed range changes, particularly in warm-adapted species like
skipjack tuna and sailfish. This apparent range expansion is
especially pronounced in Pacific skipjack tuna, which now supports
one of the largest fisheries in the world. Skipjack are
known to respond strongly to climate fluctuations, by expanding
their range further toward the Eastern Pacific during El Ninodriven
warming events. The results presented here seem
consistent with such a mechanism.
Increases both in number and range of smaller species could
also be linked to partial release from predation or competition by
larger species of tuna, billfish, and shark. Ecosystem
models for the tropical Pacific suggest that such top-down
interactions could be a powerful influence on food web structure. Likewise there is empirical evidence to suggest a rise in
smaller meso-predators following the decline of larger tuna,
billfishes, and sharks. For example, by comparing historical
and recent longlining surveys in the tropical Pacific, an
increase in skipjack, among other small species, was observed at
the same time as the decline of large sharks and tuna. Such
fisheries-induced changes in the predator field can profoundly
affect prey demographics and behavior and may cascade further
down the food web.
More generally, it is well known that the decline of a predator
can induce both abundance and distributional changes in a wide
range of prey species, ranging from ungulates to marine
mammals, reptiles, and fishes. For large pelagic predators
specifically, more research is needed to disentangle such top-down
effects from bottom-up mechanisms, such as changes in ocean
conditions or food supply. For example, Polovina presented
evidence for a partial range shift in Pacific bluefin tuna from the
late 1970s onward, during which the abundance of juvenile bluefin
increased in the Western and decreased in the Eastern Pacific.
This was correlated with a climate-driven increase in prey availability
in the Western Pacific. Similarly, Perry et al. demonstrated
northward range shifts across a diverse fish community in
the North Sea that were thought to relate to changes in average
temperature condition. It was not clear, however, whether total
range sizes would be affected by these latitudinal shifts.
Range contractions in commercial fishes were reported previously
on more local scales. A pelagic example is the endangered
Monterey Spanish mackerel (Scomberomorus concolor),
a commercially valuable species that extended north to Monterey,
California in the 1880s but whose range is now reduced to
the northern part of the Gulf of California. Similarly,
Brodie et al. described a large range contraction for yellowtail
flounder (Limanda ferruginea) from groundfish trawl
survey data around Newfoundland. This was seen primarily as a
function of low stock size, which resulted from increased fishing
pressure in the mid- to late 1980s. They showed that the area
occupied by this stock was positively correlated with its abundance
as estimated from surveys but not with bottom temperatures
from these same surveys. Similar changes were seen in
a number of other heavily fished groundfish species at the same time and suggest that the rangeabundance pattern may
be present in exploited groundfish as well as the pelagic species
considered here.
In contrast to the above-cited groundfish example, our study is
largely based on fisheries-dependent data and thus needs to be
interpreted with more caution. Importantly, we are looking at the
observed ranges as revealed by fishing. For some of the species
under study this may cover only part of their total range. Changes
in range can be detected reliably only in those cells that have
sufficient effort; hence we limit our conclusions to those cells.
One possible caveat is that these estimated range changes might
be influenced by changes in targeting practices over time that
affect the relative catchability of species. We have accounted
for some of these changes in the longlining data, which have been
depth-corrected according to ref. 45. However, other, more subtle
changes might have occurred, such as changes in hook size, line
material, and set time, among others. Although such changes
would certainly have an effect on the relative abundance of species
in the catch, we assume it unlikely to eliminate catch or
bycatch of a species entirely, if that species still occurs regularly in
the area. By limiting our interpretations to species presence or
absence (given sufficient effort to detect a species), our results are less likely to be affected by such changes in catchability. One
species for which doubts remain over data reliability is skipjack
tuna. This small species features low catchability by longlines,
which makes it less detectable in the Japanese data. Additionally,
there were very large expansions of purse seine fishing for this
species during the 1960s1970s and onward, which could influence
some (but probably not all) of the apparent range expansion
in the Pacific. We also note that the most recent
assessments indicate a decline in skipjack abundance, which
might also influence its current range. Finally, there is the possibility
that changes in reporting or in fishing regulations could
influence the observed range. A recent closing of southern bluefin
spawning grounds during the spawning season, for example,
reduces the odds of detecting the species. We would like to emphasize
the importance of ongoing fisheries-independent tagging
and tracking studies to gain further insight into the total ranges of
these species and how they might change over time.
In conclusion, our results suggest that tuna and billfish can
show significant and large changes in their observed range, which
may be correlated to changes in their abundance and distribution
as driven by fishing, ocean conditions, and species interactions.
Hence the double jeopardy of correlated abundance and range
losses seems to apply not only on land but in the oceans as well.
These results have implications for spatial management, because
they imply that even wide-ranging, highly mobile species can be
extirpated from parts of their range. Such local losses will change
their availability to fisheries and effectively terminate the ecological
role they once played in the affected regions.
Further ReadingYou can view the full report by clicking here. |
February 2013


