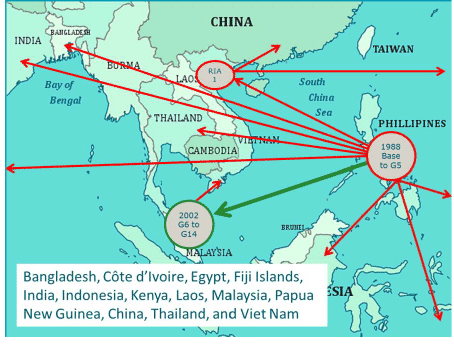
The Genetic Improvement of Farmed Tilapia (GIFT) project started in 1988 in the Philippines (Eknath and Acosta, 1998). The main aim was genetic improvement in harvest weight of Nile tilapia (Oreochromis niloticus). Development of the project and its execution been described in detail in various publications (Eknath et al., 1993, 1998, 2007; Acosta and Eknath, 1998; Bentsen et al., 1998; reviewed in Eknath and Hulata, 2009). Initial results obtained between 1988 and 1997 indicated that genetic improvement could produce harvest gains of 12-17%. Between 2000 and 2002, fish selected from 6th generation (G6) GIFT Nile tilapia strain were moved to Malaysia, where a new base population was created and selection continued (reviewed in Ponzoni et al., 2011). In addition, several subsets of families starting from G6 were distributed to other countries and used to start new selective breeding programs (Figure 1).
 In 2006, fifty full-sib families of generation 10 were transferred to RIA-II in the Mekong delta of Vietnam. Harvest weight has continued to be the main trait of interest, and detailed reports showing that there have been genetic gains in harvest weight ranging between 7-11% per generation over four to six generations have been published (Kwah et al., 2008; Ponzoni et al., 2011; Thodesen et al., 2012). Data from breeding programs conducted with other Nile tilapia strains by WorldFish in Abbassa, Egypt, indicate that similar or even higher gains are feasible. In this paper we review results from these breeding programs in terms of genetic gains and correlated responses, and highlight some future directions.
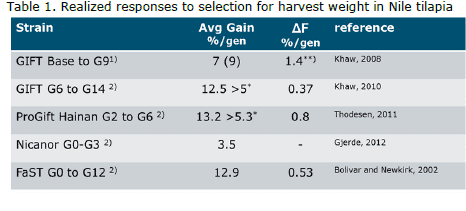
Selection response. Responses to selection in various populations of Nile tilapia are summarized in Table 1.
Responses of 7-11% are large compared to livestock breeding and raise the question whether they represent values that can be expected on the basis of theoretical expectations. Genetic gain can be predicted as the product of selection intensity, accuracy of selection, and estimate of additive genetic standard deviation. A simplified version of the breeders equation (G(%) = i·h2·CV) to derive desired gains, was used (Sae-lim et al., 2012). The use of the phenotypic coefficient of variation (CV=σ/μ) allows for a comparison across breeds, harvest weights, and production systems. The range of values of these parameters as typically reported in the literature, and the expected min. and max. weight gains in % can be seen in Table 2.
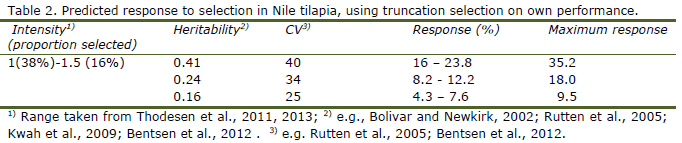
Table 2 illustrates that the reported gains are within the range of expected values when truncation selection on „own performance? would have been used. Two reasons for this are: (1) the CV values reported here are based on „raw? data and will be in the lower range of 27-32 after correction for fixed effects; (2) most of the reported selected proportions are lower than the 1.5 taken here as the upper limit. Selected proportions of females can be as high as 45% (values reported by Thodesen et al. 2011; 2013). The "Maximum response" column presents gains that can be attained with selected proportions of 2.5% for males and 5% for females. Such high selection intensities are not unrealistic and could double genetic gain.
Inbreeding. Increasing selection intensities will reduce the number of subjects selected (“outstanding”) but increases the risk that these will come from only a few families. Most breeders will therefore avoid selection intensities which are too high as this increases the risk of inbreeding and reduces long term additive genetic variance. Pedigree analysis of selected strains (Table 1) show that rates of inbreeding are well below 0.5-1%, considered acceptable for long term breeding. Selection based on estimated breeding values, using best linear unbiased prediction methods (BLUP) increases the risk of inbreeding as full-sib family members will have more similar breeding values. Most breeders will correct for this by avoiding full-sib mating or by using specific algorithms such as optimal contribution theory (Meuwissen, 1997). In the GIFT strain in Malaysia, inbreeding was avoided by selecting only one male and two females from each full-sib family (Ponzoni et al., 2010). Avoiding full-sib mating has little effect on the rate of inbreeding in the long term (Dupont-Nivet and Vandeputte, 2011). However, an often overlooked fact is that it can be very beneficial, short term. Inbreeding had strong negative effects in offspring of half- and full-sib matings in Nile tilapia from the WorldFish Center strain in Egypt (Fessehaye et al., 2009). Inbred offspring had lower survival after overwintering (Fessehaye et al., 2007) and both female fecundity and male reproductive success declined by 11% and 40%, respectively, for every 10% increase in inbreeding (Fessehaye et al., 2009).
Correlated responses to selection for harvest weight (HW)
Growth rate: Harvest weight has been the main trait of interest for genetic improvement in Nile tilapia. However, commercial producers are often more concerned with growth rate during the grow-out period, because high growth rate is associated with higher feed efficiency, especially with more restricted feeding regimes (Henryon et al., 2002). Growth rate can be expressed as average daily gain (ADG), specific growth rate (SGR), or daily growth coefficient (DGC) (Jobling, 2003; Dumas et al., 2010). Of these, DGC (calculated as HW1/3–TW1/3 /days growth, with HW= harvest weight and TW= tagging weight) is preferred as a simple growth model for harvest weight prediction and production planning under various conditions (Bureau et al., 2000; Jobling, 2003). There are several advantages from a technical point of view for using DGC. First, fitting a good growth curve corrects for differences in grow out time and differences in tagging weight and harvest weight, making comparisons across experiments and generations easier. Secondly, using DGC corrects for heterogeneity of variances between tag weight and harvest weight. A disadvantage is that DGC estimates could be biased when selective mortality takes place between tagging and harvest (Ouweltjes et al., 1988). First estimates of genetic correlations between DGC and harvest weight (corrected for tagging weight and age) indicate that these will be high (rg 0.94; Trong et al., 2013a) and that selection for higher harvest weight will increase growth rate.
Fillet weight and fillet yield: Fillet weight and fillet yield are the main traits of economic interest for most commercial tilapia producers. Fillet yield can differ considerably between strains (Rutten et al., 2004). Fillet weight has high genetic correlation with body weight at harvest (0.99) but genetic correlations with fillet yield (0.74 ± 0.18, Rutten et al., 2005) or dressing-% (0.65 ± 0.47, Charo-Karisa et al., 2007) were much lower. Even lower estimates of genetic correlations between harvest weight and fillet yield (0.44 ± 0.20, Nguyen et al., 2010; 0.22 ± 0.31, Gjerde et al., 2012; 0.09 ± 0.18, Thodesen et al., 2012) have been reported. These correlations are all positive but come with high standard error values. It is therefore not evident that selection for harvest weight will lead to increments in fillet yield. There has been a 0.3% unit increase in yield per generation which corresponds to less than 1% response per generation (Thodesen et al., 2012) while no correlated response in fillet yield after selection for harvest weight has also been reported (Nguyen et al., 2010).
Shape: Fillet yields might be influenced both by age and by body weight (Thodesen et al., 2012). Older individuals have lower fillet yield than younger individuals, while the positive effect of body weight on fillet yield is more significant in older individuals (Rutten et al., 2004; Thodesen et al., 2012). One explanation for this observation could be that the shape of tilapia changes with age and sexual maturation. Shape is usually described by body dimensions or as a condition factor (W/L3). Genetic correlations of harvest weight with length, height, or width are invariably high (>0.98, e.g. Charo-Karisa et al., 2007; Trong et al., 2013a) but only width/thickness could to some extent be used as a predictor of fillet-yield (Rutten et al., 2005). Estimates of rg for condition factor with harvest weight are typically around zero, or even negative, and come with large standard errors (e.g. -0.12 ± 0.30, Trong et al., 2013a). Recently, we reported genetic correlations between harvest weight and ellipticity, a new trait that combines two size measures, e.g. length and height, to describe the size of a fish as an ellipse: EL-H = (L-H)/(L+H) (Figure 2). In this equation, values range from 0 to 1 with larger values describing more elongated shapes. Estimates of rg between HW and ELH, ELT, and EH-T were 0.47, -0.15, and -0.42, respectively (Trong et al., 2013a).
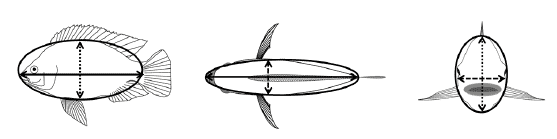
Genetic correlations with DGC were also strongly negative for ELT and EHT: -0.42 and -0.52, respectively. Together, these values tell a complex story in which selection for higher harvest weight will result in faster growing fish that become more elongated in the mid-sagittal plane, and rounder in the transverse and frontal plane. Future experiments are needed to determine how these measures will correlate with fillet yield (Nguyen et al., 2007).
Harvest weight and maturation: little research has been conducted on the genetics of reproductive performance in Nile tilapia. In many livestock species, long-term selection for high production efficiency resulted in physiological, immunological, and reproductive problems (reviewed by Rauw et al., 1998). Typical reproductive problems are defective eggs and poor semen quality in chicken, delayed age at puberty, and farrowing in pigs, and low success rates after insemination in dairy cattle. In Nile tilapia, traits of interest are age and size at first reproduction (maturity), fecundity, and fertility. A zero genetic correlation between growth and maturity in laboratory reared Nile tilapia was reported (Kronert et al., 1989). Visual inspection of live fish to assess maturity has been used and a significant effect of body weight at harvest on frequency of early maturing males but not females, in the GIFT strain in the Philippines has been found (Longalong et al., 1999). A non-significant genetic correlation of 0.18 ± 0.24 between maturity and harvest weight in Nile tilapia of the World Fish Center strain in Egypt was found (Charo-karisa et al., 2007). In this last study, animals were slaughtered and maturity was assessed by visual inspection of gonads. From these studies, it can be concluded that selection for improved harvest weight will not result in early maturation of females.
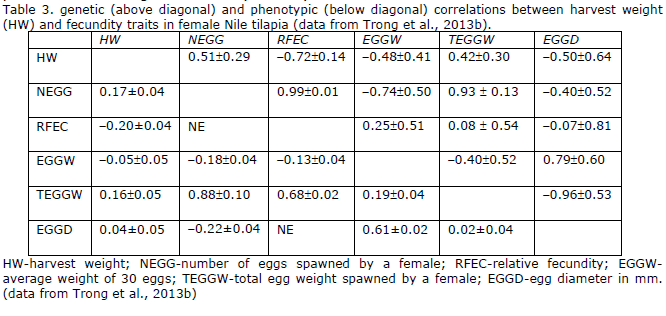
Harvest weight and fecundity: Genetic correlations for harvest weight with reproductive traits using females from generation 12 of the GIFT sub strain kept at RIA-2 in Vietnam have been estimated (Trong et al., 2013b). Spawning records were obtained from single pair mating as well as group mating experiments. Heritability estimates for fecundity traits (egg size, egg number, total egg weight, and relative fecundity) were low, ranging from 0.05 – 0.08 (Table 3). Genetic correlations for HW with numbers of eggs spawned and total egg weight spawned were positive, while correlations for HW with relative fecundity, egg weight, and size, were negative. Genetic correlations between spawning weight of females and fecundity traits were stronger than those between HW and fecundity traits. It can be concluded that HW has favorable genetic correlations with NEGG and RFEC, which are the desired characteristics for Nile tilapia seed production. However, there is a risk that Nile tilapia females selected for large HW will produce smaller eggs, which might lead to problems with long term fertility and fry survival.
Concluding remarks and future directions
Most breeding programs discussed here have been successful in terms of improving harvest weight. Correlated responses in production traits are favorable and negative responses in reproductive traits have not yet been reported. There is a need for caution and continued monitoring for undesired correlated responses in health and welfare related traits. Improvement in the following areas are advised:
Reproduction in Nile tilapia breeding programs is notoriously difficult and family production can occasionally take up to three months or more. This is primarily caused by the mating design in which single males are mated sequentially with two females to produce the required number of half/sib families (usually 50 or more). The consequences in terms of genetic gain are considerable: (1) the selection intensity goes down as breeders go down the list of selection candidates to find females and males that will spawn; (2) the extended range in spawning dates results in prolonged hapa/tank rearing and large environmental effects common to full-sibs; (3) prolonged reproduction times can reduce the genetic gain by 20% per year due to increased generation intervals. We have shown that family production can be shortened to only one month when single males are mated to 10 females in groups (Trong et al., 2013c). Group mating is more similar to the natural way of reproduction in Nile tilapia and reduces stress due to aggression of the males. Preliminary results from family production in RIA-II with generation 14 of the GIFT strain show that groups of only five females are sufficient to produce the required numbers of families in one month. Interestingly, such a scheme could also be used to increase the selection intensity in males by increasing the mating ratio from 1:2 to 1:3 or more as males often mate with more than two females in a tank.
Genotype by environment interaction has been thoroughly studied in Nile tilapia. Genetic correlations for HW measured in a wide range of environments are positive and do not give cause for concern (reviewed in Ponzoni et al., 2011). However, the genetic correlations between cage cultured tilapia fed on commercial pellets and those in less intensively managed ponds tend to be lower (Trong et al., 2013a). Selection in high input environments has been predicted to lead to higher gains but also increased environmental sensitivity, while selection in low input environments would produce less gain but more „robust? animals (Falconer, 1989). Commercial harvest weights now typically range from 800 to 1400 g in intensive cage cultures while harvest weights in low input ponds do not exceed 200 g. More research is needed to determine whether Falconer?s prediction holds for tilapia and to determine the „best? selection environment given the strain and its uses.
Breeding programs evolve as new traits are added. It can be concluded that a starting breeding program would do well by focusing only on growth rate and harvest weight, using simple mass selection in combination with a rotational cohort design to control rates of inbreeding. However, more sophisticated designs are needed when new traits are added to the breeding goal. Traits of interest are salinity tolerance, low-temperature tolerance, and disease resistance. Such traits are difficult to measure, and show phenotypic plasticity, subject to environmental conditions (e.g. cold tolerance (Charo-Karisa et al., 2005). Selection for these traits requires sib testing facilities for adequately measuring the phenotypes. Genomic selection, now widely adopted by livestock industry, might prove too expensive for tilapia breeding programs, especially since generation intervals are short. However, when traits are difficult and expensive to measure, it might be an economically viable alternative.
June 2014

