Executive Summary
The volume of fish, the sum of fish catches and aquaculture generated by the individual EU Member States, is estimated to be 6.6 million MT for 2007, with Spain, Denmark, France, the UK and the Netherlands as the leading countries. Fish catches contribute almost 80% to the total EU volume, and aquaculture accounts for the remaining, or 1.3 million MT. The consumption of fish in the EU is estimated to be around 10 million MT and demand is expected to continue to go up.
The EU is a net importer of fish products and the trade deficit continues to grow. The EU depends more than ever on imports to meet its fish demand. EU import volumes from third countries increased by a quarter over the past 5 years. Norway remains the largest supplier of fish. China has become the second largest supplier. The third and fourth largest suppliers are the U.S. and Iceland, respectively. The most important product group, in terms of volume, the EU imports from third countries is frozen fish fillets, mainly Alaska pollack, pangasius and cod. The second and third largest product groups are frozen shrimp and prawns and tuna and skipjack, respectively.
The U.S. is the third largest supplier of fish to the EU. U.S. export volumes grew by almost 20% over the past 5 years. In terms of value, exports doubled to over 1 billion dollars. Roughly half of U.S. fish export is Alaska pollack. Cod and surimi together represent another 20% of U.S. exports to the EU.
Growth markets within the EU continue to be frozen fillets of e.g. Alaska pollack, cod, pangasius, monkfish and haddock. Imports of halibut, mollusks, scallops, lobsters, Sockeye salmon, anchovies and dried fish have also gone up considerably, although these products represent a smaller market within the EU. Finally, demand gradually increased for prepared and preserved fish like surimi, shrimp, prawns, caviar and caviar substitutes.
This report is the result of collaboration with other FAS colleagues. We recommend that the report is read in conjunction with the EU Fisheries Policy Report, written by the US Mission to the EU in Brussels, Belgium – Gain Report Number E48029. This report can be downloaded from http://www.fas.usda.gov/scriptsw/attacherep/default.asp.
I. Fish Catches and Aquaculture
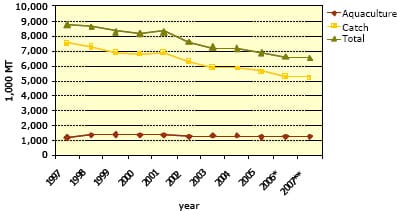
The volume of fish, the sum of fish catches and aquaculture generated by the individual EU Member States, is estimated to be 6.6 million MT for 2007. Over the past decade, the volume went down by roughly a quarter, mainly due to decreasing catch limits1.
Within the EU, the top 5 largest generators of fish continue to be Spain, Denmark, France, the UK and the Netherlands. They together represent an estimated 60% of the generated volume, although their market share is slightly decreasing, especially for Denmark and Spain.
Total Fish Production EU-27, 1997-2007
Fish Production Per Country, 1997-2007
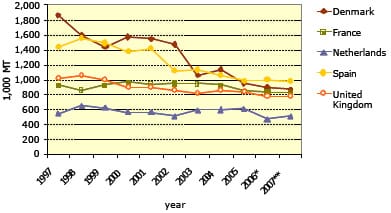
Source: Eurostat, * preliminary figures, ** FAS/The Hague estimates
Fish catches contribute almost 80% to the total EU fish volume. The five main fish species, in volume, are Atlantic herring, European sprat, blue whiting, sandeels and Atlantic mackerel. The North-East Atlantic fishing region continues to be the main region for catching fish. As the stock for many fish species is below the safe biological limits, catch limits are put in place. Further development of the Common Fisheries Policy will determine future fish catches by EU member states.
Fish Catches and Aquaculture Production, 2007
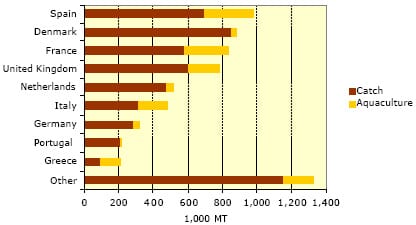
The contribution of aquaculture has grown slowly to around 1.3 million MT, or over 20% of total EU seafood volume2. The aquaculture sector can be split up into the fin fish sector (trout, salmon, carp, sea bream, etc.) and shell fish sector (mussel, oyster, etc.), with equal volume figures. Industry contacts indicate that the production of fin fish, especially sea bream, sea bass, cod and northern blue fin tuna, will continue to grow. Growth will mainly come from the Mediterranean countries (sea bream and sea bass). EU shell fish production is expected to remain stable. Future aquaculture production will heavily depend on new aquaculture production sites and licenses, fish feed prices, environmental issues and the development of technology.
II. Consumption
EU pelagic fish (e.g. herring and mackerel), which is considered to be a lower value fish, is not only consumed in Europe but large volumes are also exported to several countries in Africa. The lower value demersal fish species (e.g. Alaska pollock) are very popular by food processing companies that target the mainstream retail market. The higher value demersal fish species (e.g. sole) are traditionally used by restaurants and can increasingly also be seen as a component in ready-to-cook meals in upscale retail markets.
The combined population of all 27 member countries has been estimated at almost 500 million. Appendix 3 shows that the average per capita consumption of fish in the EU is around 2 2 kg per year3 which results in a total consumption within the EU of almost 11 million MT.
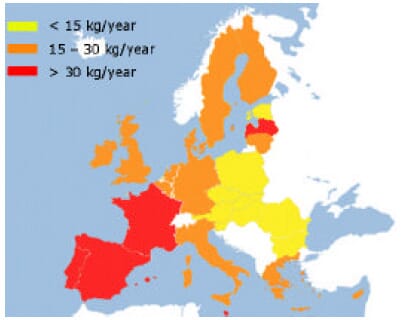
There are huge differences between the various MS. The lowest per capita consumption of fish, up to 15 kg per year, can be found in the Central and Eastern European Member States. The North West European Member States show average consumption figures between 15 and 30 kg of fish per year whereas people in Southern European countries eat more fish. In Portugal and Spain, the per capita consumption of fish is 60 and 40 kg per year, respectively.
Demand for fish in the EU is expected to continue to go up. The most important drivers are considered to be the predominance of large food retail chains, which result in greater availability of various seafood products, and growing demand by consumers for healthy and safe animal protein products, since fish has a healthy image. Finally the slightly growing EU population and the improvement of economic conditions in some new EU Member State s add to a growing demand.
III. Trade
The EU is a net importer of fish products. Between 2002 and 2007, the EU’s trade deficit grew by roughly a third in volume , from 2.5 million to 3.5 million MT. The EU depends more than ever on imports to meet its fish demand.
The 27 EU Member States imported last year an estimated 8.9 million MT of fish. Spain, France, Italy, Germany and the Netherlands were the largest importers. Over 5.0 million MT were imports from third countries, the remaining being intra EU trade. EU import volumes from third countries increased by a quarter over the past 5 years4. Neighboring Norway remains the largest supplier of fish with an estimated market share for 2007 of 9.4% (of total EU imports, including intra EU). China has become the second largest supplier with exports that more than tripled over the past 5 years. Individual import market shares of other main suppliers like the U.S., Iceland, Argentina and Thailand have been stable at around 3%. Exports from Vietnam grew enormously from 32,000 MT in 2002 to an estimated 256,000 MT in 2007, and Vietnam is now the fifth largest supplier of fish to the EU. Ecuador and Peru were able to double their market share over the same period. The once leading suppliers Russia and the Faroe Islands were not able to benefit from the EU’s growing deficit. In terms of value the increase of EU fish imports grew at a much faster pace , due to rising seafood prices5. Average import prices grew by 50% over the past 5 years.
Fish Imports Per Country, 2002-2007
Fish Imports Per Specie, 2002-2007
Source: Global Trade Atlas, *FAS/The Hague
The most important product group, in terms of volume, the EU imports from third countries is frozen fish fillets, mainly Alaska pollack, pangasius and cod6. Main suppliers include China, Vietnam and the U.S. EU imports of pangasius from Vietnam grew enormously, making Vietnam the second largest supplier of frozen fish fillets to the EU. China and the U.S. continue to be the leading suppliers of Alaska pollack while the majority of cod comes from China, Iceland, Russia and Norway.
The second largest product group is frozen shrimp and prawns, with Greenland, Ecuador, India, China, Brazil and Argentina as the main supplying countries. Ecuador, Thailand and Seychelles are the leading supplying countries of the third largest product group, prepared and preserved tuna and skipjack. Norway continues to be the main supplier by far of farmed salmon, the fourth largest product group. Finally, squid and cuttlefish are supplied by India, Falkland Islands, Thailand, China and Morocco.
IV. Opportunities
The U.S. is the third largest supplier of fish to the EU. U.S. export volumes grew by almost 20% over the past 5 years7. In terms of value, exports doubled to over 1 billion dollars. Roughly half of U.S. fish exports is Alaska pollack. Cod and surimi together represent another 20% of U.S. exports to the EU. Other noteworthy products include hake, mackerel, salmon, cuttlefish, squid, lobster and scallops.
EU imports of almost all fish species continue to grow as a result of growing demand and declining EU production. Within the big bulk of frozen fish fillets, imports of Alaska pollack, cod, pangasius, monkfish and haddock have demonstrated the strongest growth.
EU imports of shrimp, prawns and farmed salmon grow annually by approximately 10%. Imports of halibut, mollusks, scallops, lobsters, Sockeye salmon, anchovies and dried fish have also gone up, although these products represent a smaller market within the EU. Finally, EU demand for prepared and preserved fish like surimi, shrimp, prawns, caviar and caviar substitutes gradually increased.
Further Reading
| - | You can view the full report by clicking here. |
April 2008
